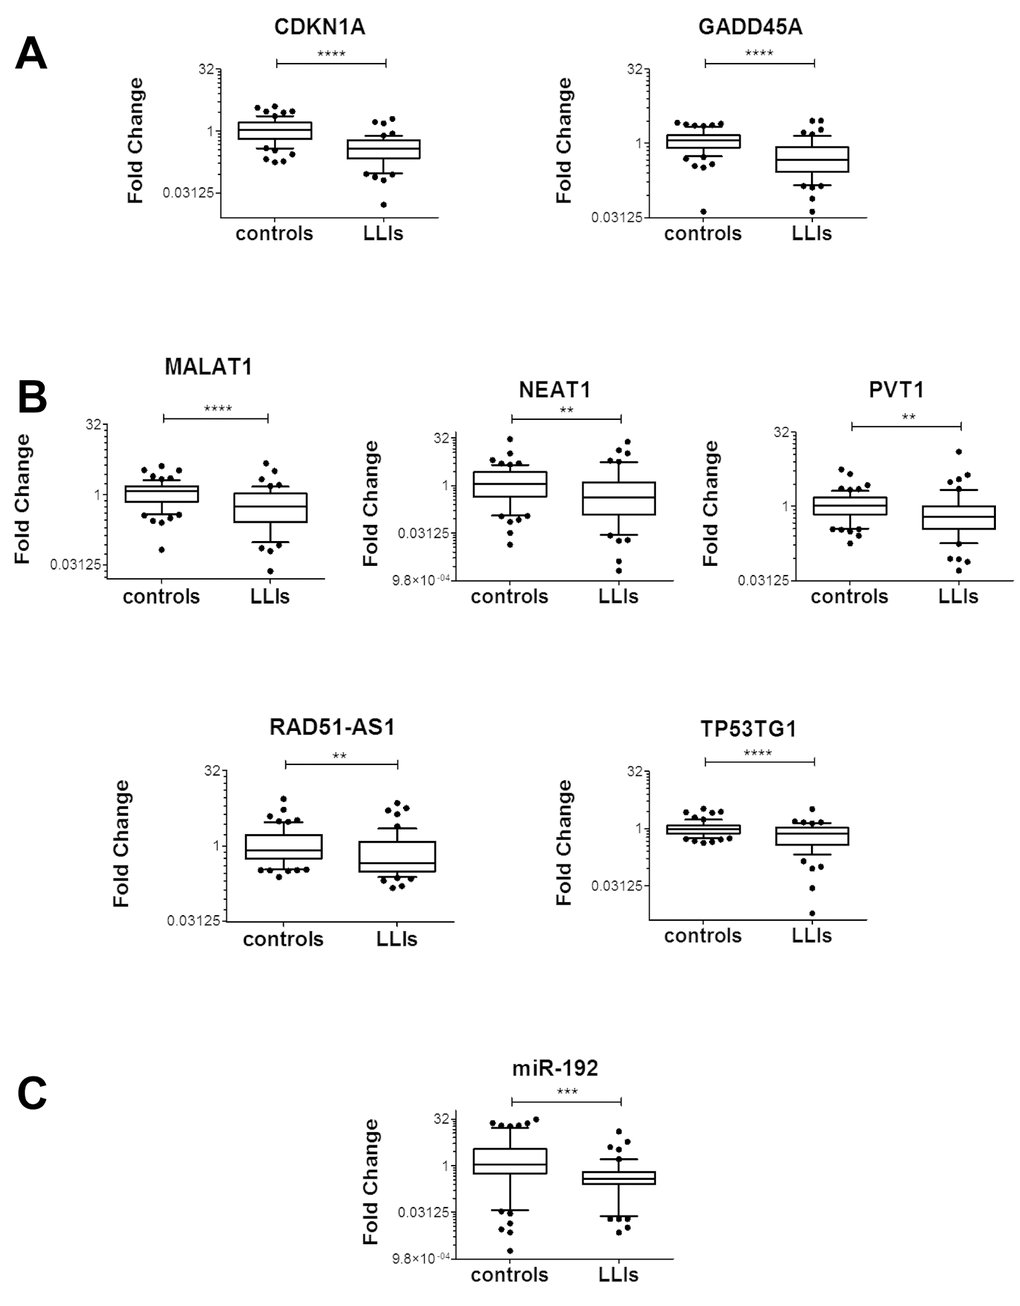
Figure 9.Association between H2O2-responsive RNA levels and life-span. Box plots of the indicated RNAs in LLIs (n= 53) versus controls (n= 65); (*p≤0.05, **p≤0.01, ***p<0.001, ****p<0.0001 after adjustment for sex distribution). (A) Coding RNAs. (B) LncRNAs. (C) miRNAs.