Submit an Article
Navigate
Home
Editorial Board
Editorial Policies
Current Volume
Archive
Scientific Integrity
Publication Ethics Statements
Interviews with Outstanding Authors
Newsroom
Sponsored Conferences
Podcast
Contact
Special Collections
Submit an Article
Online ISSN: 1945-4589
Research Paper
|
Volume 9, Issue 12
|
pp. 2489–2503
Age-related gene expression changes, and transcriptome wide association study of physical and cognitive aging traits, in the Lothian Birth Cohort 1936
Back to article
Figure 3
(3 of 3)
−
100%
+
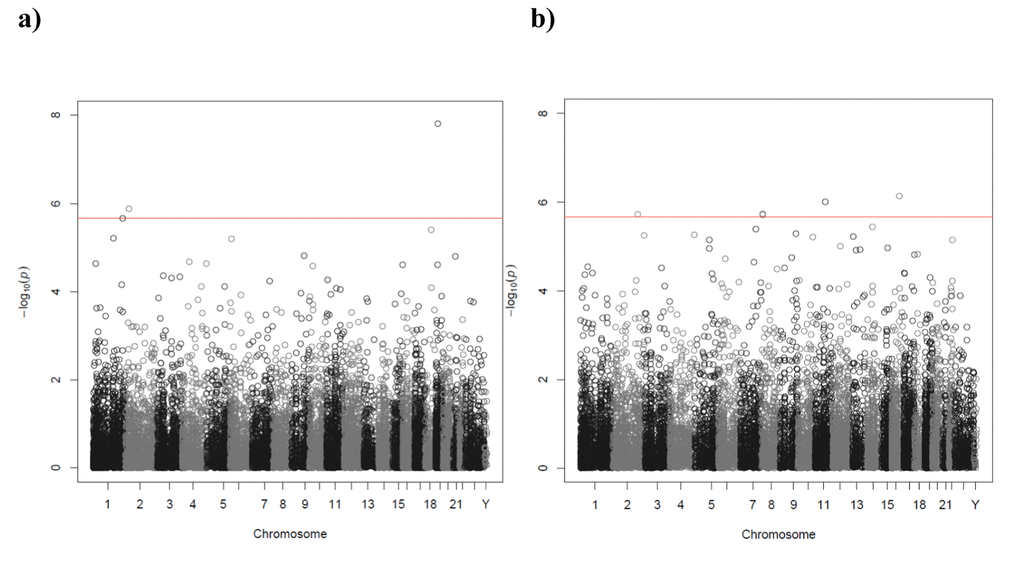
Figure 3.
Manhattan plot of the P-values of the transcriptome-wide association analyses for (
a
) smoking status (current versus never) and (
b
) telomere length. The red line indicates the threshold for transcriptome-wide significance (P<2.17x10
-6
).