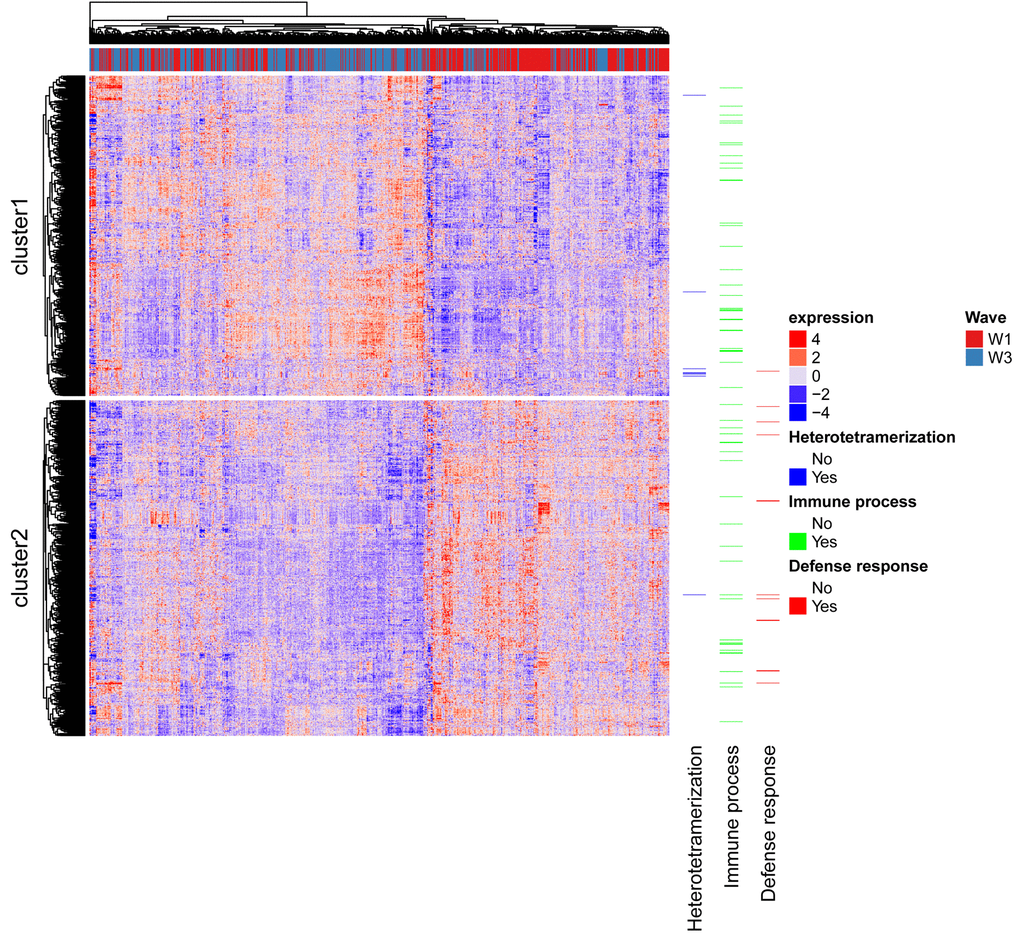
Figure 2.Heatmap of gene expression profiles across individuals. Rows are probes and columns are individuals with the red/blue bar along the top indicating to which wave the column corresponds. Genes linked to the top term identified in each GO analysis are shown.