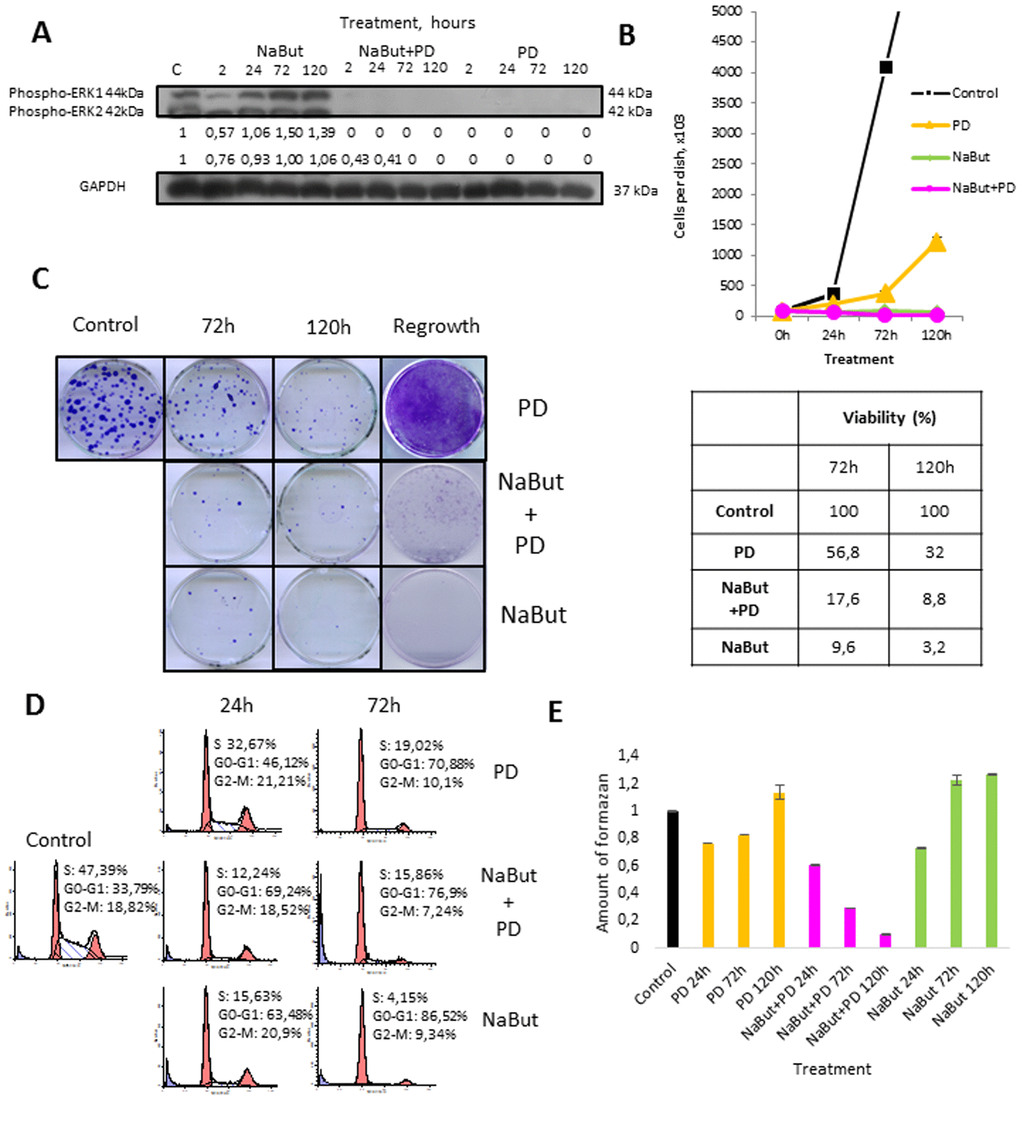
Figure 1.Autophagy promotes survival upon MEK/ERK inhibition in control ERas cells but cannot rescue senescent cells. (A) Western-Blot analysis of ERK1,2 phosphorylation after short-term (2 h) and long-term (24 h-120 h) NaBut, NaBut+PD and PD treatment. Cells were cultivated with inhibitors for the indicated time and then lysed and processed to Western-blotting in 12% gel. Numbers below present densitometry of bands. (B) Growth curves of cells after exposure to inhibitors. The number of cells was counted after 24, 72 and 120 hours of experiment. Data are presented as mean ±S.E.M. of three independent replicates (n=3). (C) Clonogenic viability and proliferative potential of cells after removing the inhibitors. Cells were cultivated with inhibitors for 72 h and 120 h and then seeded at 200 cells per 30mm dish in drug-free medium. Clones were stained with Crystal Violet after 7 days of growth. Data are presented as mean ±S.E.M. of three independent replicates (n=3). For regrowth assay, cells were treated with inhibitors for indicated time and then provided with fresh inhibitor-free medium. Clones were stained Crystal violet after 5 days of growth in fresh media and counted. (D) Cell cycle distribution after exposure to inhibitors was analyzed by flow cytometry of propidium iodide-stained cells. Percentage of cells in G1, S and G2 phase indicated. (E) Viability was analyzed by MTT-test, amount of formazan was measured at 570 nm wavelength. Data are presented as mean ±S.E.M. of three independent experiments (n=3).