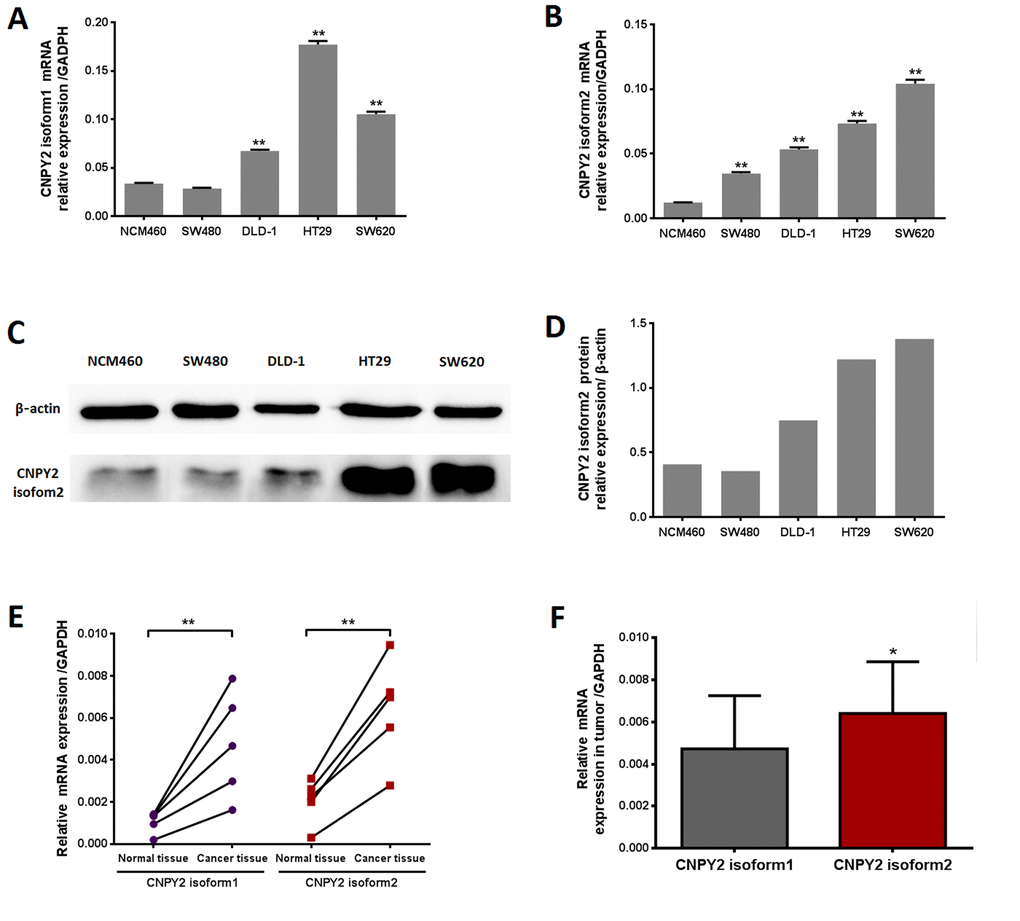
Figure 1.CNPY2 mRNA expression evaluated by RT-PCR. (A) CNPY2 isoform1 mRNA was significantly higher in CRC cell lines (DLD-1, SW620, and HT29) than normal colonic epithelial cells (NCM460) **, P < 0.01. (B) CNPY2 isoform2 mRNA was significantly increased in all CRC cell lines (SW480, DLD-1, SW620, and HT29) compared to that in NCM460 cells, **, P < 0.01. (C) Protein expression of CNPY2 isoform2 in CRC cell lines (SW480, DLD-1, SW620, and HT29) and NCM460 cells determined by western blot. (D) The relative expression of CNPY2 isoform2 in NCM460, SW480, DLD-1, SW620, and HT29 was 0.41, 0.36, 0.75, 1.22 and 1.38, respectively. (E) Expression of the two CNPY2 isoforms was significantly higher in tumor tissues than in tumor-adjacent normal tissues (n = 5, **, P < 0.01). (F) Expression of CNPY2 isoform2 was significantly higher compared to that of CNPY2 isoform1 in tumor tissues (n = 5, *, P < 0.05). Relative expression of CNPY2 mRNA was normalized to the internal reference gene GAPDH.