Submit an Article
Navigate
Home
Editorial Board
Editorial Policies
Current Volume
Archive
Scientific Integrity
Publication Ethics Statements
Interviews with Outstanding Authors
Newsroom
Sponsored Conferences
Podcast
Contact
Special Collections
Submit an Article
Online ISSN: 1945-4589
Research Paper
|
Volume 9, Issue 10
|
pp. 2209–2222
Senescence-associated ultrastructural features of long-term cultures of induced pluripotent stem cells (iPSCs)
Back to article
Figure 6
(6 of 9)
−
100%
+
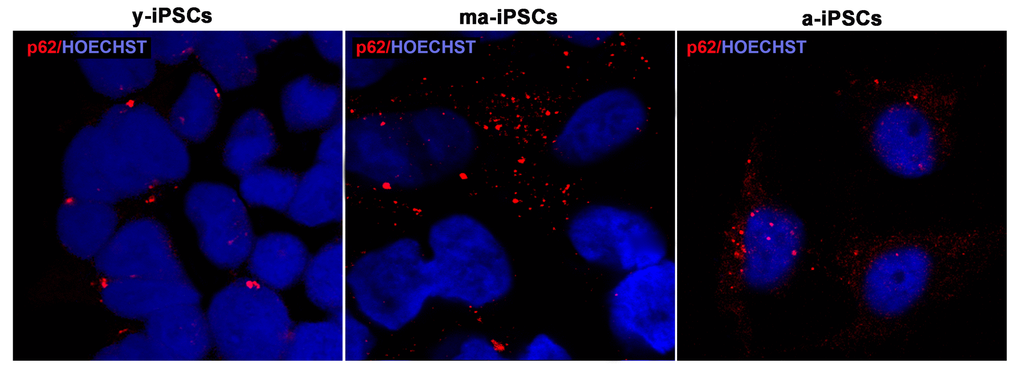
Figure 6.
Confocal microscopic images of y-, ma- and a-iPSCs marked with p62 (in red) and Hoechst (in blue) showing abundant granular p62 immunopositivity in ma-iPSCs and in a-iPSCs when compared with y-iPSCs.