Submit an Article
Navigate
Home
Editorial Board
Editorial Policies
Current Volume
Archive
Scientific Integrity
Publication Ethics Statements
Interviews with Outstanding Authors
Newsroom
Sponsored Conferences
Podcast
Contact
Special Collections
Submit an Article
Online ISSN: 1945-4589
Research Paper
|
Volume 9, Issue 6
|
pp. 1623–1639
Sodium fluoride causes oxidative stress and apoptosis in the mouse liver
Back to article
Figure 6
(6 of 14)
−
100%
+
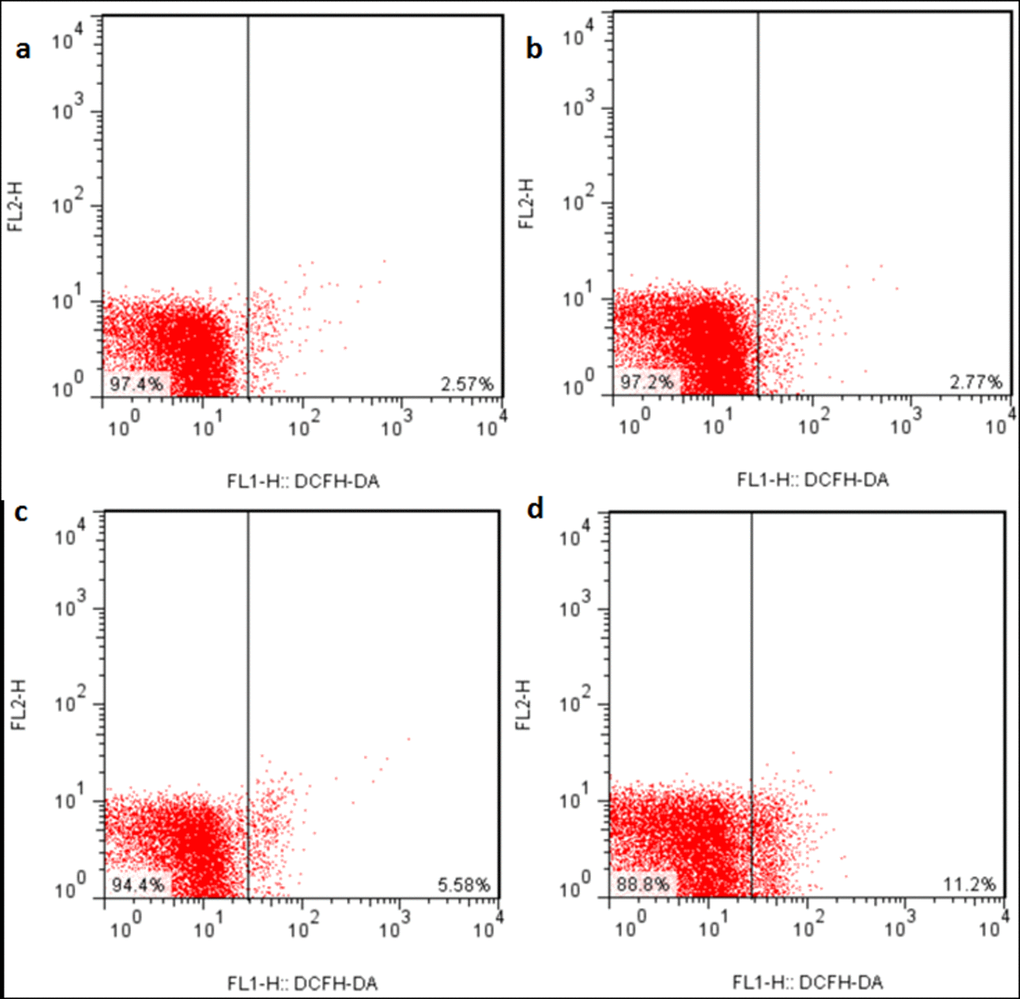
Figure 6.
ROS production levels in the liver at 21 days of the experiment.
Control group (
a
), 12mg/kg (
b
), 24mg/kg (
c
), 48mg/kg (
d
).