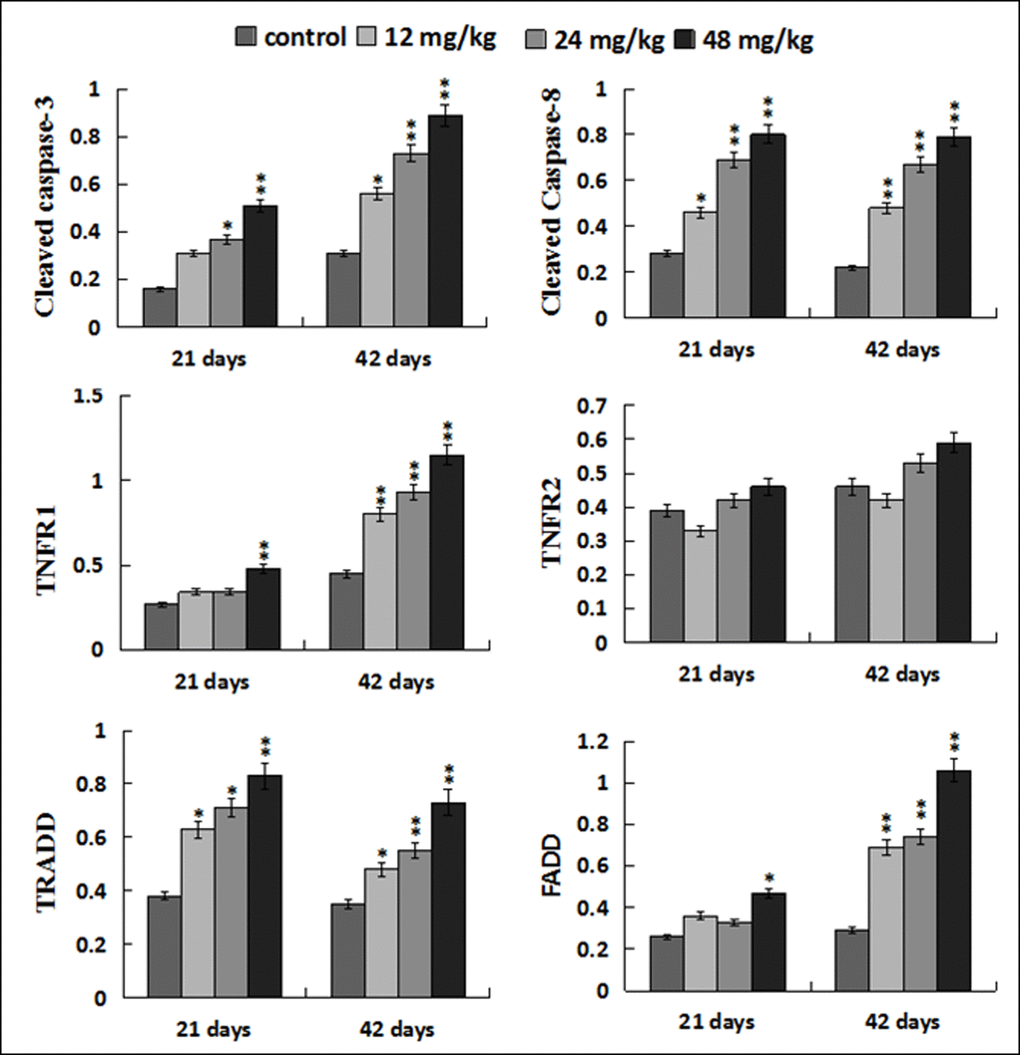
Figure 14.Changes of protein expression levels of apoptotic parameters associated to TNF-α signaling pathway in the liver. Data are presented with the mean ± standard deviation (n=8). *p < 0.05, compared with the control group; **p < 0.01, compared with the control group.