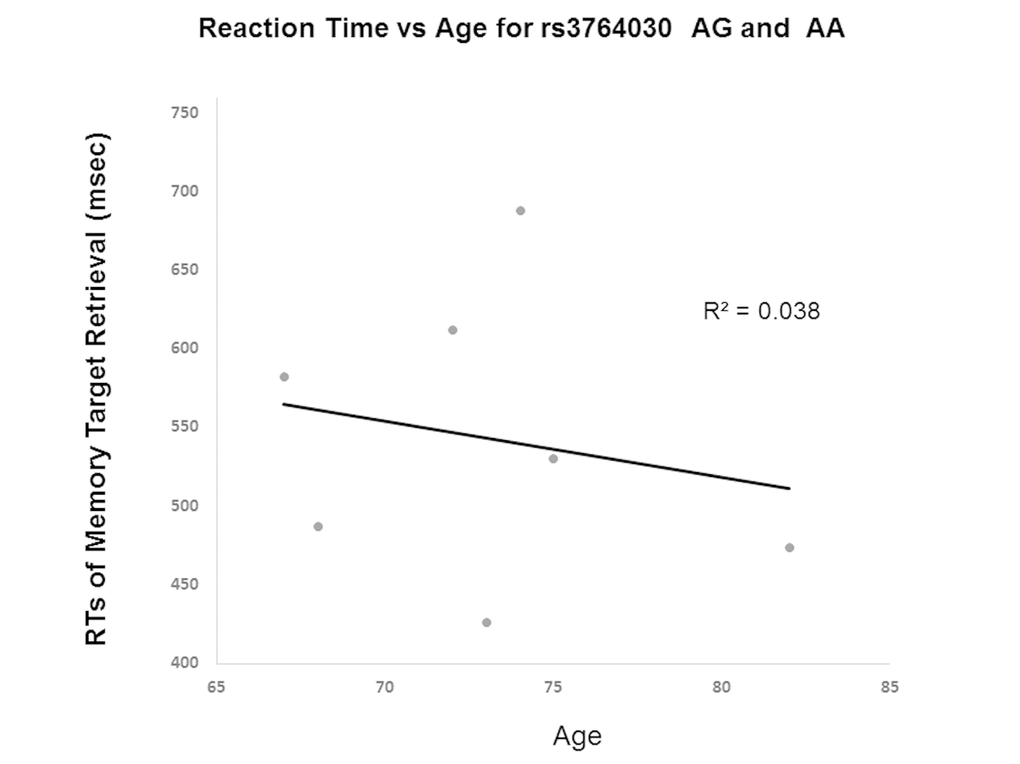
Figure 5.Reaction time in Experiment 2 participants with increasing age based on A allele carrier status (AA and AG genotypes). A significant difference in the slopes of the regression lines was observed for A allele carriers (-3.58 ± SE 0.21) versus the GG genotype (13.1 ± SE 0.20) (p < 0.001).