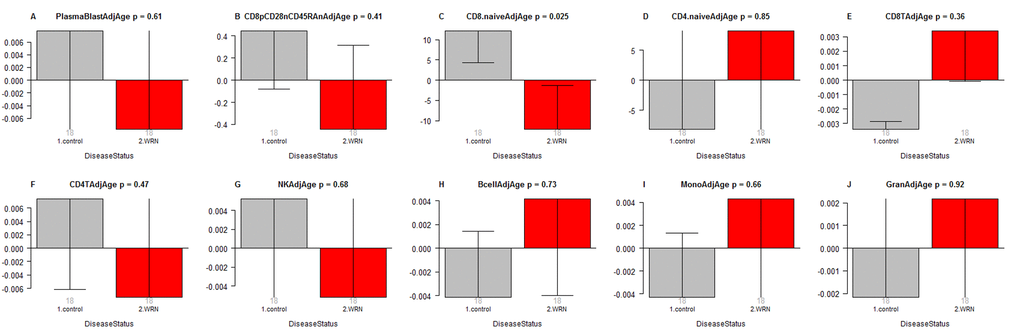
Figure 2.Age adjusted blood cell counts versus Werner syndrome status. WS status (x-axis) versus the age adjusted estimate of (A) plasma blasts, (B) exhausted CD8+ T cells (defined as CD8+CD28-CD45RA-), (C) naïve CD8+ T cell count, (D) naïve CD4+ T cell count, (E) CD8+ T cells, (F) CD4+ T cells, (G) natural killer cells, (H) B cells, (I) monocytes, (J) granulocytes. The abundance measures of blood cell counts were estimated based on DNA methylation levels using the epigenetic clock software. Each bar plot depicts the mean value (y-axis), one standard error, and the group size (underneath the bar). The p-value results from a non-parametric group comparison test (Kruskal Wallis).