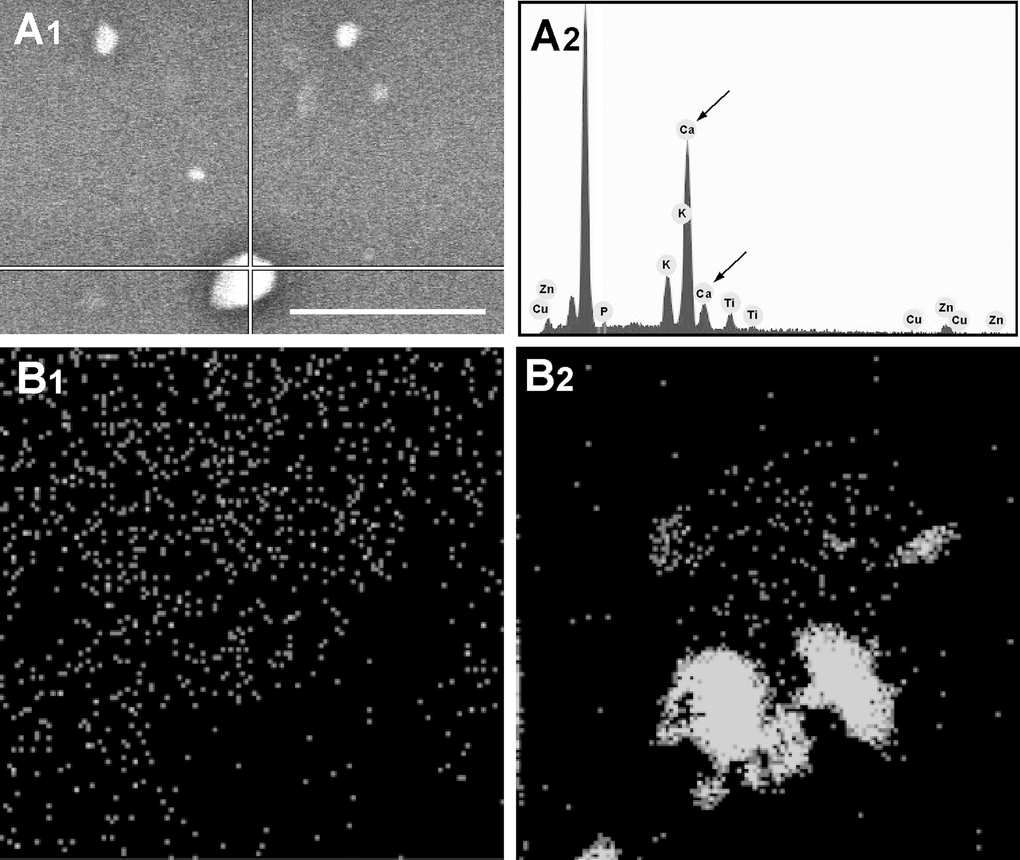
Figure 6.Spot mode microanalysis of an MV (A1) with its corresponding plot (A2); arrows indicate Ca spikes. Scale bar 5μm. Larger MVs are usually brighter and have a higher Ca content. Ca mapping of MVs from (B1) young and (B2) senescent HUVEC. Ca is seen as grey on the black background.