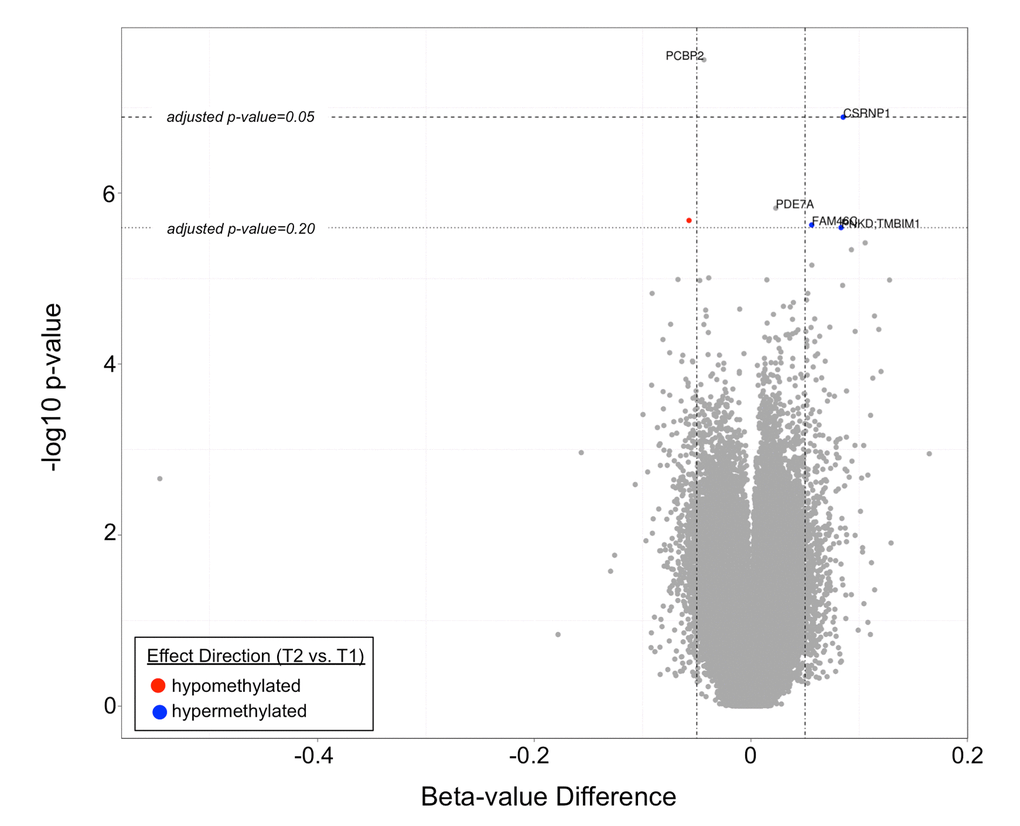
Figure 3.A volcano plot demonstrating differentially methylated CpG sites in T2 vs. T1. Two CpG sites (corresponding to PCBP2 and CSRNP1) had q-values <0.05, while four additional CpG sites (corresponding to PDE7a, FAM46C, PNKD:TMBIM1, and an unknown gene) had q-values <0.20.