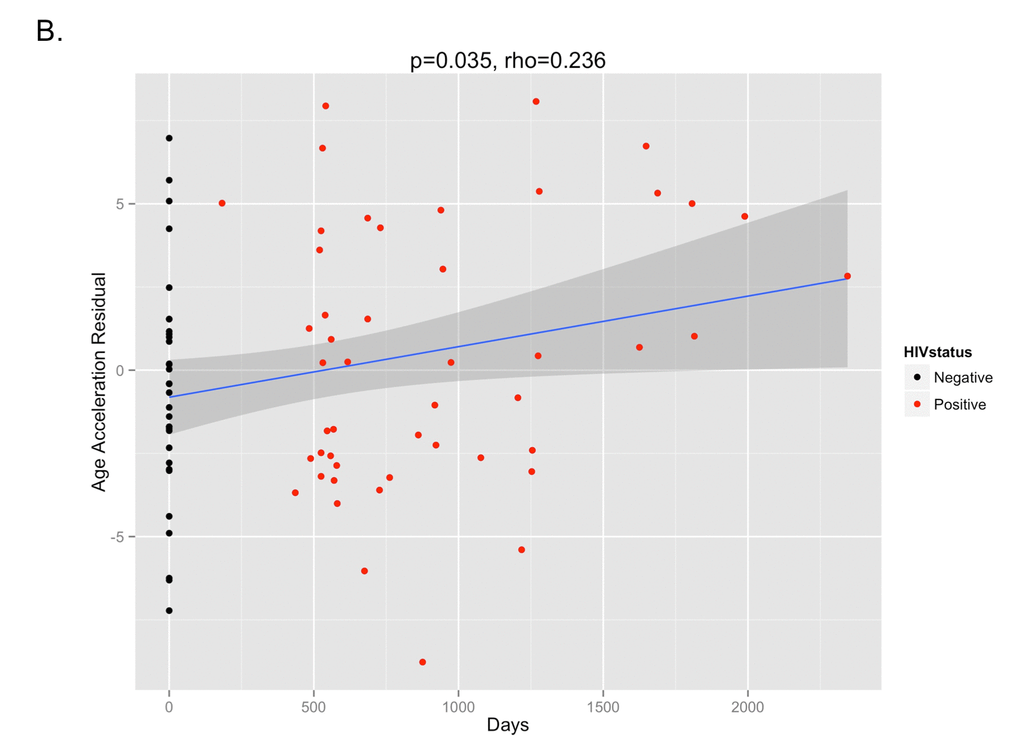
Figure 2B.The age acceleration residual (greater positivity on this scale represents more advanced methylation age in relation to chronologic age) increases over the time course of HIV infection (p=0.035, Pearson’s rho=0.236). Black dots represent HIV-negative time points (T1) while red dots represent HIV-positive time points (T2 and T3).