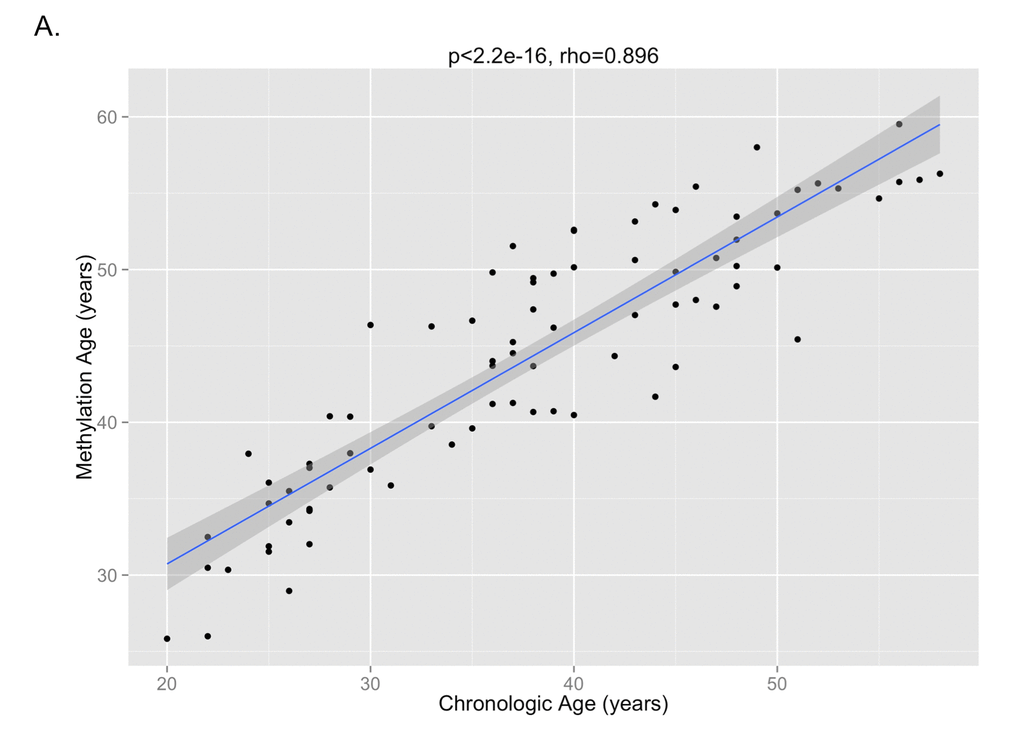
Figure 2A.The correlation between DNA methylation age and chronologic age from all subjects inclusive of all time points is shown, demonstrating a high correlation between the two measures (p<2.2e-16, Pearson’s rho=0.896).
Figure 2A — Longitudinal study of surrogate aging measures during human immunodeficiency virus seroconversion | Aging