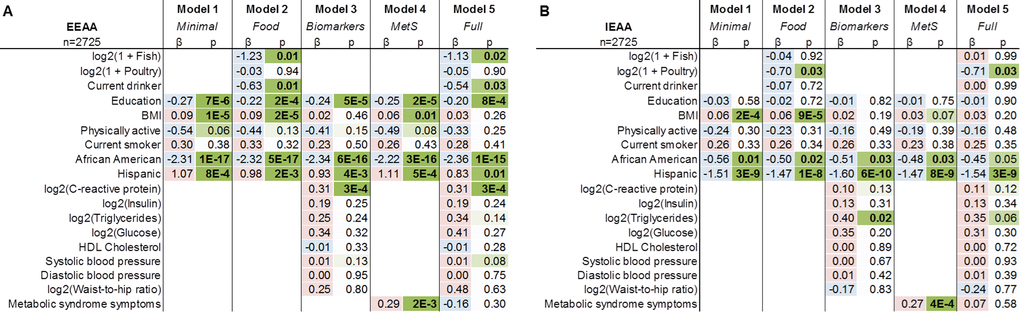
Figure 3.Multivariate linear models of EEAA and IEAA with and without biomarkers in the WHI. EEAA (panel A) and IEAA (panel B) were regressed on potential confounding factors, fish and poultry intake and current drinker status, and select biomarkers. Individual columns list the corresponding coefficient estimates (β) and p-values (p) for each fitting. Coefficients are colored according to sign (positive = red, negative = blue) and significance according to magnitude (green). Models 1 through 5 correspond to a minimal model, a model including dietary intake variables, a model including potential explanatory biomarkers, a model including number of metabolic syndrome symptoms and a complete model with all of the variables above, respectively. Models are adjusted for originating dataset (BA23 or AS315).