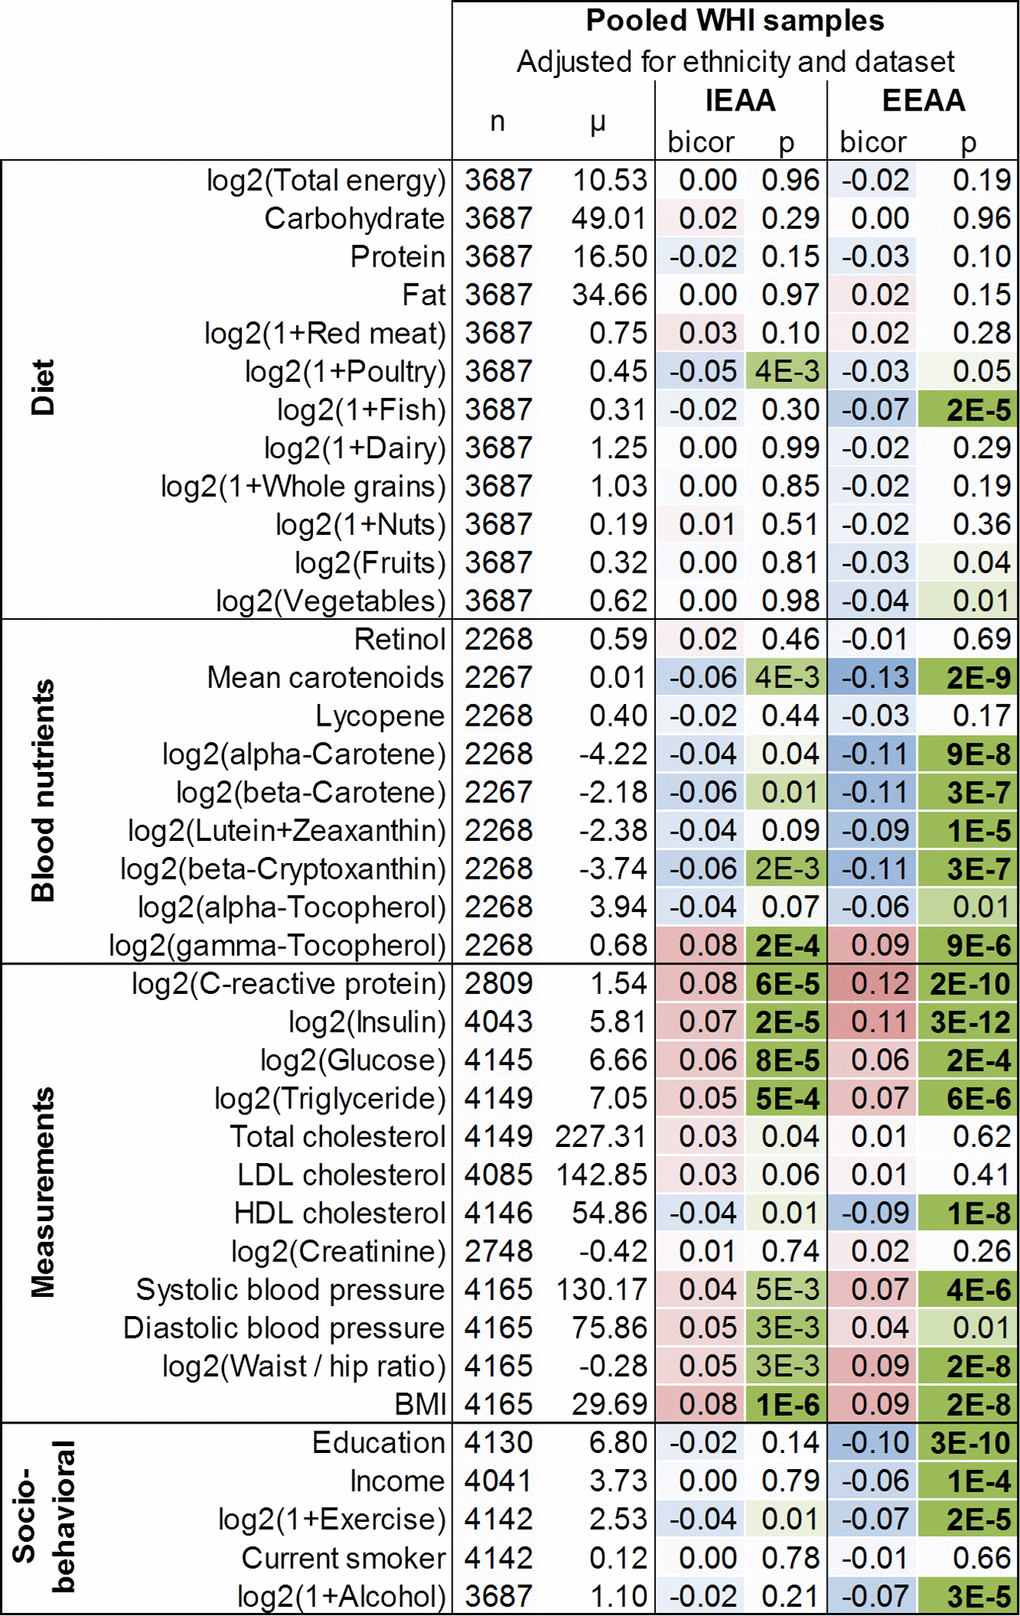
Figure 1.Marginal correlations with epigenetic age acceleration in the WHI. Correlations (bicor, biweight midcorrelation) between select variables and the two measures of epigenetic age acceleration are colored according to their magnitude with positive correlations in red, negative correlations in blue, and statistical significance (p-values) in green. Blood biomarkers were measured from fasting plasma collected at baseline. Food groups and nutrients are inclusive, including all types and all preparation methods, e.g. folic acid includes synthetic and natural, dairy includes cheese and all types of milk, etc. Variables are adjusted for ethnicity and dataset (BA23 or AS315).