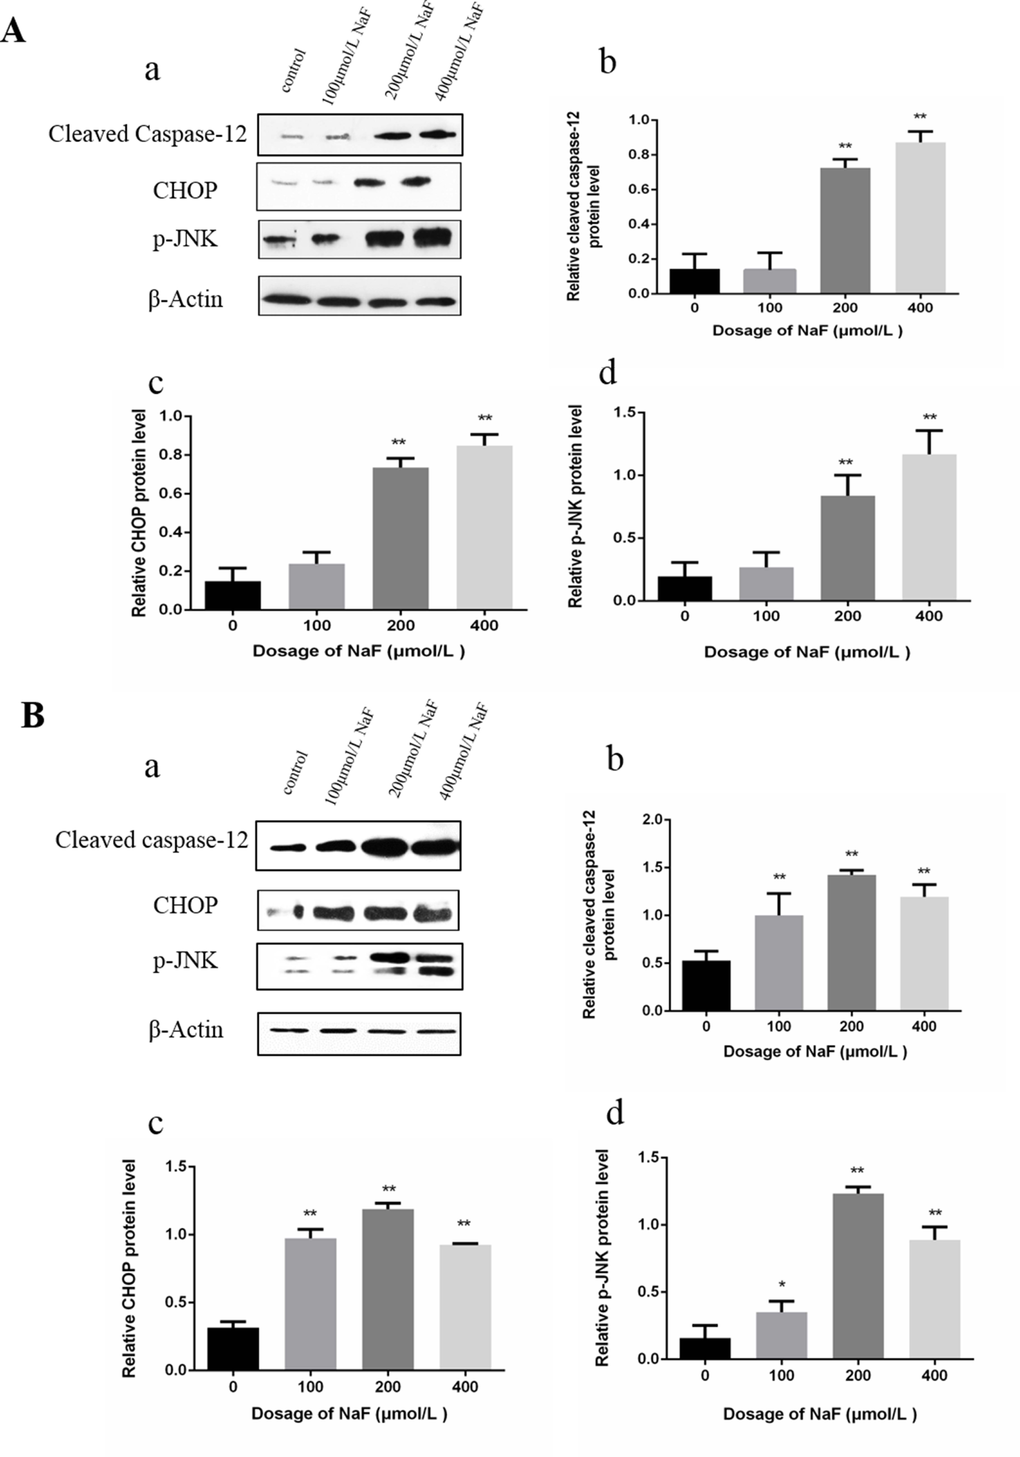
Figure 7.Effect of NaF treatment on protein expression levels of cleaved caspase-12, p-JNK, CHOP in cultured splenic lymphocytes at 24 h (A) and 48 h (B). (a) The western blot assay. (b-d) Quantitative analysis of protein expression. Data are presented with the means ± standard deviation, * p < 0.05, ** p < 0.01, compared with the control group. Data were analyzed by the variance (ANOVA) test of the SPSS 19.0 software.