Submit an Article
Navigate
Home
Editorial Board
Editorial Policies
Current Volume
Archive
Scientific Integrity
Publication Ethics Statements
Interviews with Outstanding Authors
Newsroom
Sponsored Conferences
Podcast
Contact
Special Collections
Submit an Article
Online ISSN: 1945-4589
Research Paper
|
Volume 8, Issue 12
|
pp. 3520–3534
Delivery of sFIT-1 engineered MSCs in combination with a continuous low-dose doxorubicin treatment prevents growth of liver cancer
Back to article
Figure 2
(2 of 11)
−
100%
+
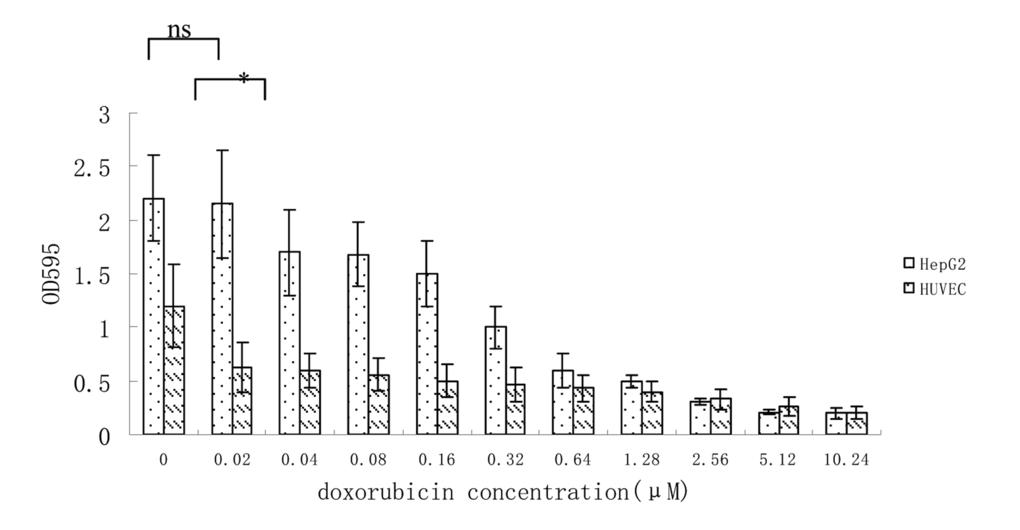
Figure 2.
Growth inhibition of HUVEC and HepG2 cells at different concentration of doxorubicin.
Data from 3 independent experiments are shown. *p < 0.05, n.s. not significant, vs 0.02μM.