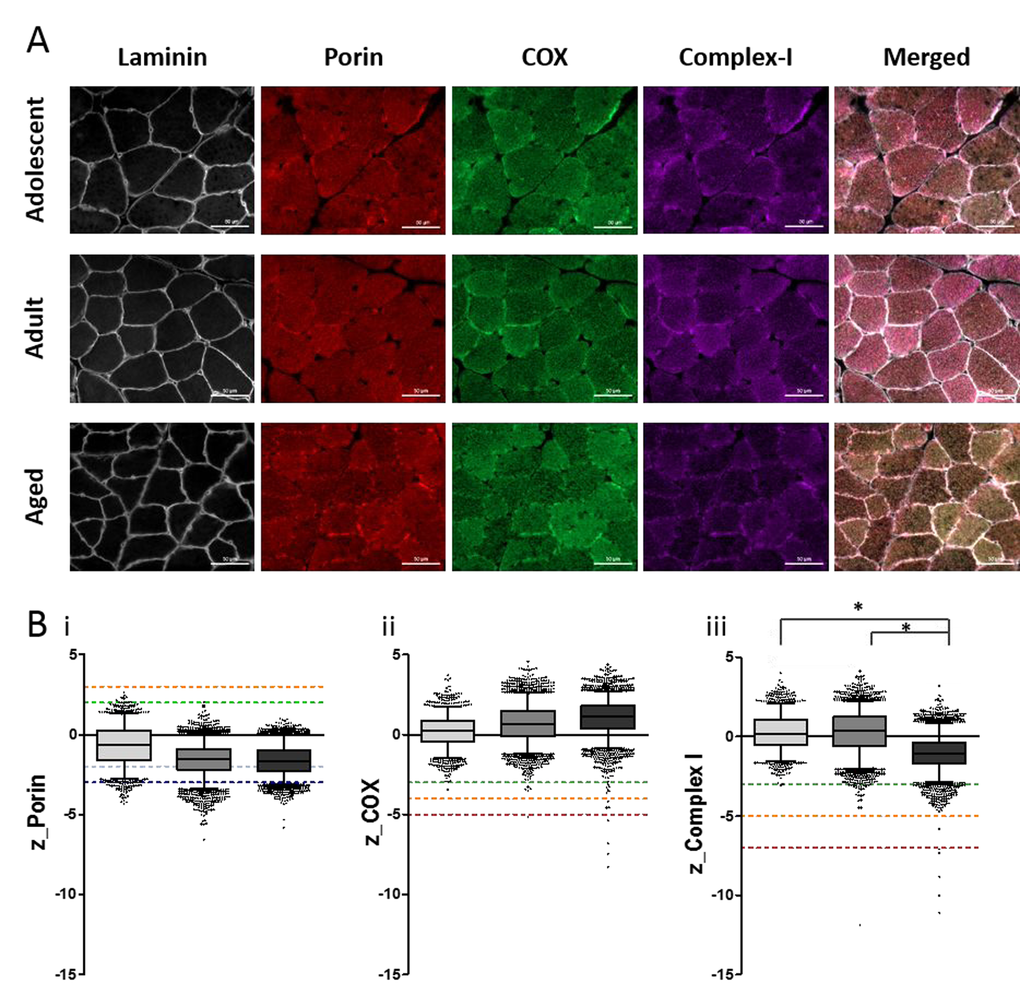
Figure 4.Quantitative quadruple immunofluorescence analysis reveals age-associated decreases in Complex I expression and no significant change in Complex IV expression. (A) 10µm sections NMR skeletal muscle (quadriceps) stained for (left to right) laminin, VDAC (porin), MTCOI (COX) and NDUFB8 (complex-I), scale bar 50µm. (B) Boxplots for NMR grouped as adolescent (light grey, n=4), adult (middle grey, n=7) or aged (dark grey, n=4), where boxes represent the first quartile, median and third quartile, and whiskers show the 5th and 95th percentiles of z-scores for (i) porin (z<-3=very low, below dark blue dotted line; -33=very high, above orange dotted line), (ii) COX (z<-5=COX-negative, below red dotted line; -5-3= COX-positive, above green dotted line), and (iii) complex-I (z<-7=CI-negative, below red dotted line; -7-3= CI-positive, above green dotted line). Kruskal-Wallis test shows significant difference in complex-I levels between the three groups (p=0.023). A Mann-Whitney test confirms significant decrease in complex-I levels from adolescent to aged group (p=0.034) and adult to aged group (p=0.0182), shown by *.