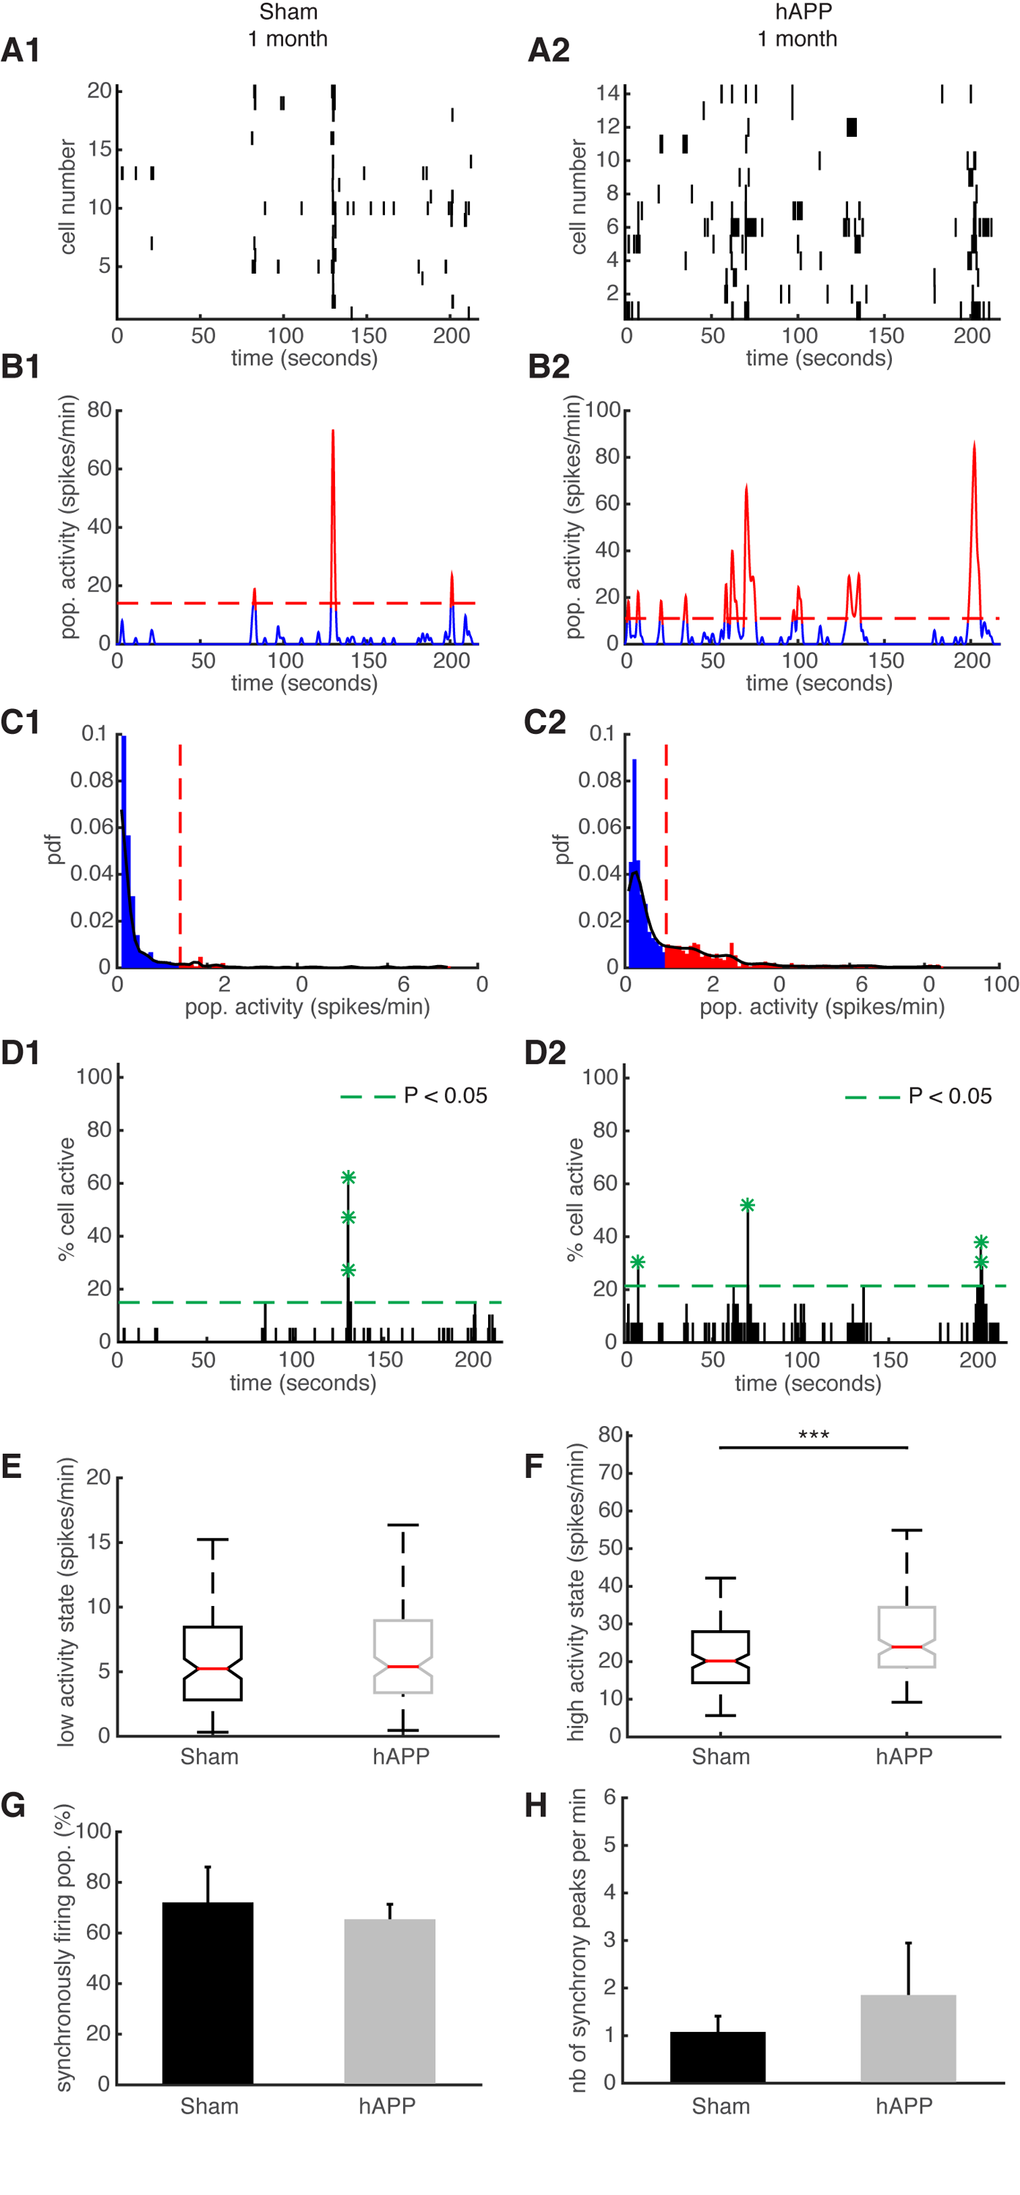
Figure 7.Synchronous firing of simultaneously recorded neurons in sham and hAPP mice 1 mpi. (A) Representative raster plots for one population of simultaneously recorded neurons. Each row corresponds to the spiking activity of one neuron. (B) Mean neural activity for the populations in A. The activity was smoothed through Gaussian filtering. The red periods correspond to the high activity states and the blue periods to the low activity states. The dotted red line represents the computed threshold between the two states. (C) Probability density function (pdf) of the population activity exhibited in (B). The black line represents the smoothed pdf, through Gaussian filtering. Red bars represent the high activity states and blue bars the low activity states. (D) Histogram representing the percentage of cells active in small time bins (~ 0.144 sec), for the population activity in (A). Asterisks mark significant peaks of synchrony. (E) Boxplots of low activity states for each mouse group (spikes/min). (F) Boxplots of high activity states for each mouse group (spikes/min). (G) Percentage of populations (simultaneously imaged neurons) exhibiting synchronous activity. (H) Mean number of synchrony peaks per minute for the different animal groups. (1) sham and (2) hAPP mice.