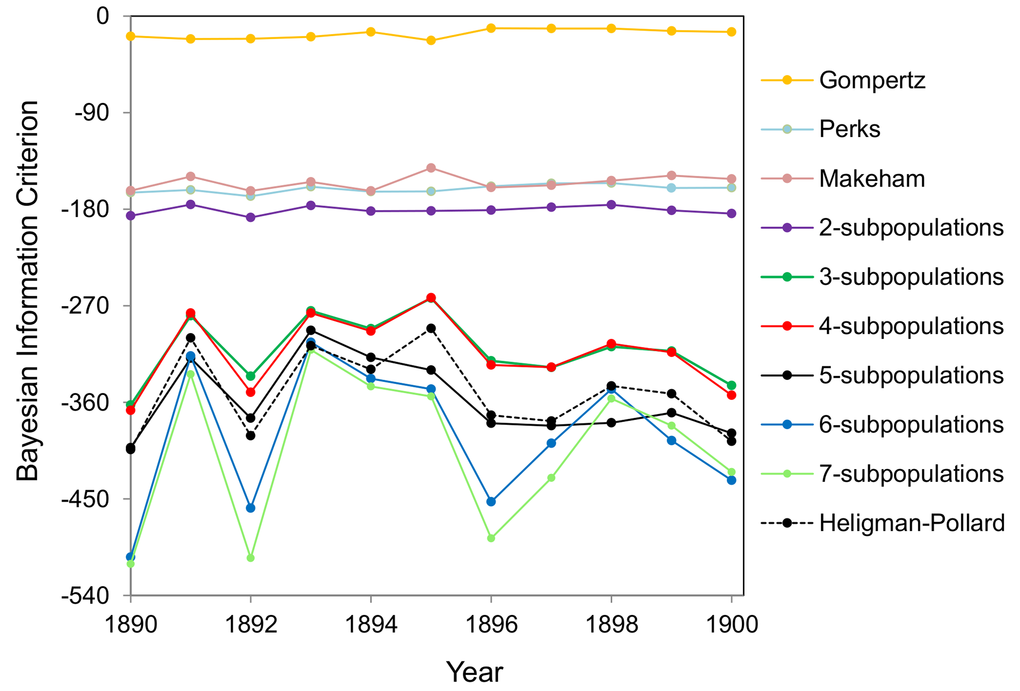
Figure 1.BIC values for different mortality models fitted to the Swedish 1890-1900 cohort mortality data. The fits by Gompertz, Makeham, Perks and Heligman-Pollard models and the fits by the model of heterogeneous population consisting of two to seven subpopulations are shown.