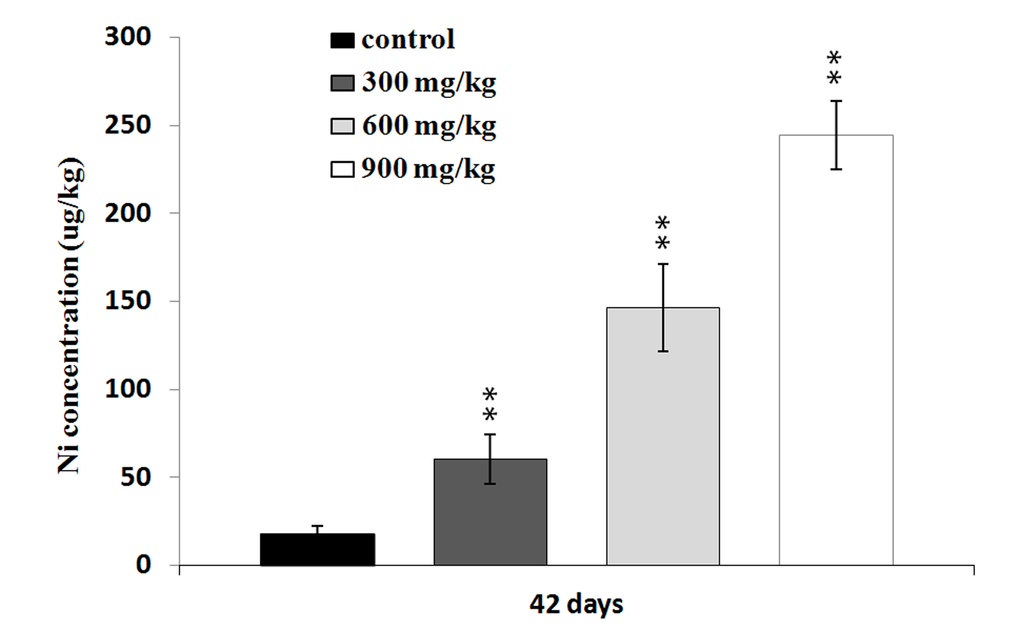
Figure 8.Changes of the Ni concentrations in the liver at 42 days. Data are presented with the mean ± standard deviation (n=5). *P<0.05, compared with the control group. **P<0.01, compared with the control group.
Figure 8 — Nickel chloride (NiCl2) in hepatic toxicity: apoptosis, G2/M cell cycle arrest and inflammatory response | Aging