Submit an Article
Navigate
Home
Editorial Board
Editorial Policies
Current Volume
Archive
Scientific Integrity
Publication Ethics Statements
Interviews with Outstanding Authors
Newsroom
Sponsored Conferences
Podcast
Contact
Special Collections
Submit an Article
Online ISSN: 1945-4589
Research Paper
|
Volume 8, Issue 11
|
pp. 3009–3027
Nickel chloride (NiCl2) in hepatic toxicity: apoptosis, G2/M cell cycle arrest and inflammatory response
Back to article
Figure 5
(5 of 8)
−
100%
+
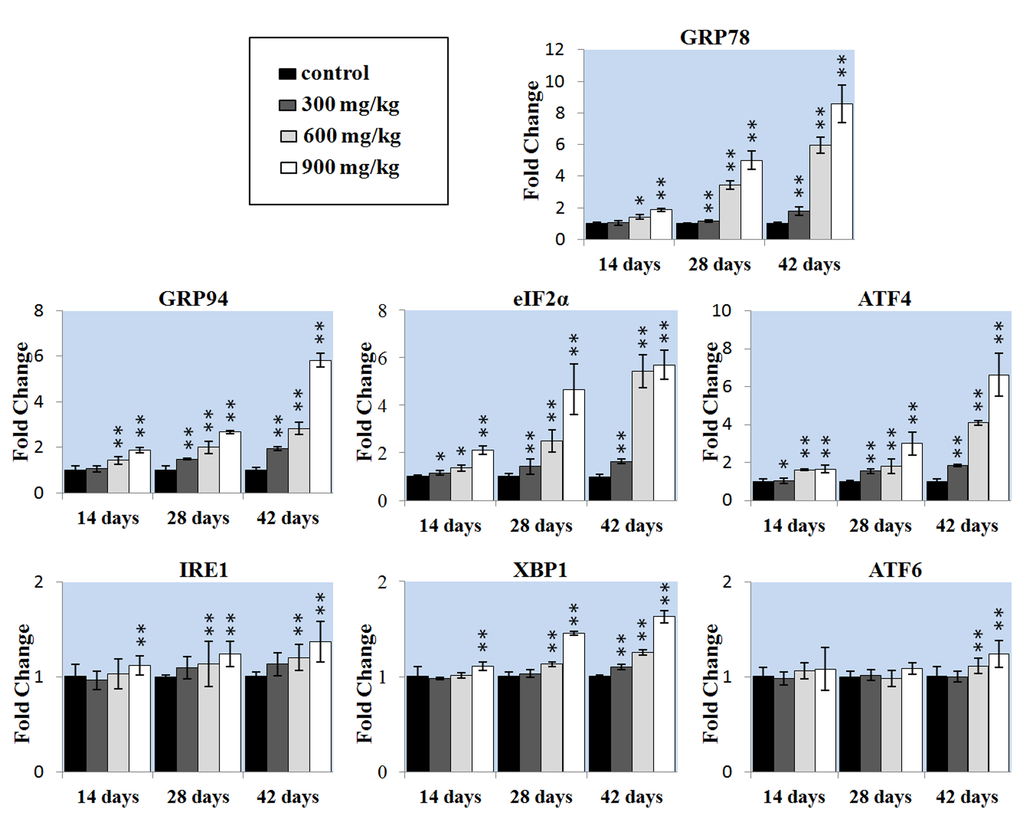
Figure 5.
Changes of the ER stress gene mRNA expression levels in the liver.
Data are presented with the mean ± standard deviation (n=5). *
P
<0.05, compared with the control group. **
P
<0.01, compared with the control group.