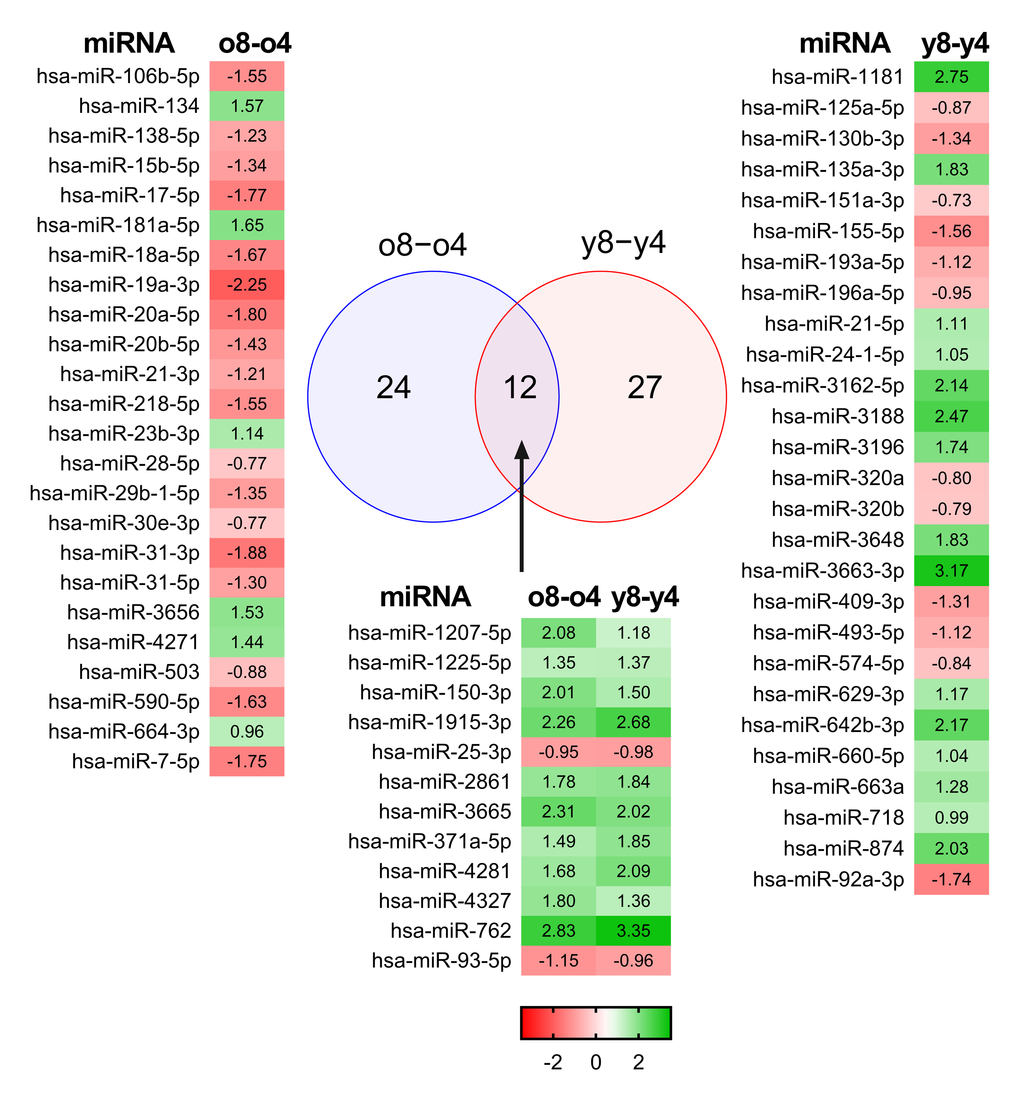
Figure 1.Differentially expressed miRNAs in BM-MSCs. Microarray analysis of young and old donors’ MSCs found 12 miRNAs whose expression was changed in young and old donors. Fold changes are presented as a heatmap where green color indicates up-regulation and red color indicates down-regulation of the microRNA.