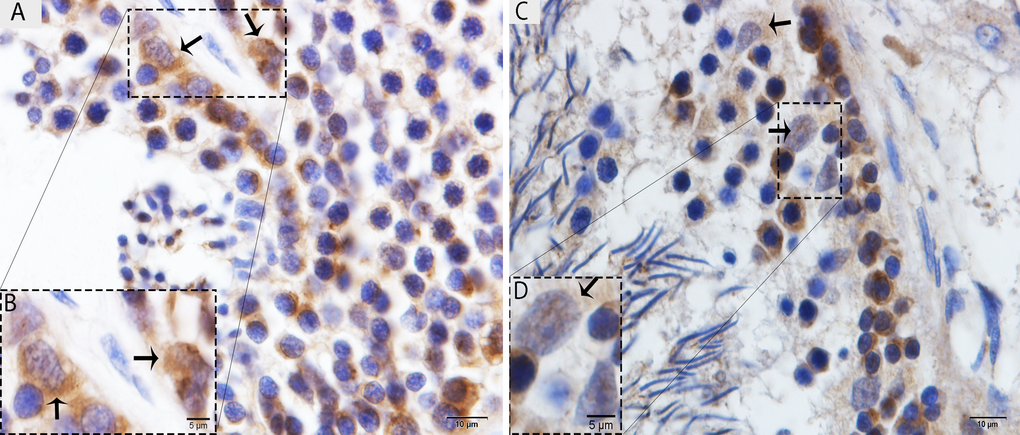
Figure 2.Light micrograph of LC3 localization in the testis. (A) The immunoreactivity shows strong positive expression on the Sertoli cells in May. (B) A higher magnification of the rectangular area. (C) Weak, positive expression on the Sertoli cells in October. (D) Illustration of rectangular area. Scale bar= 10μm (A, C) and 5μm (B, D).