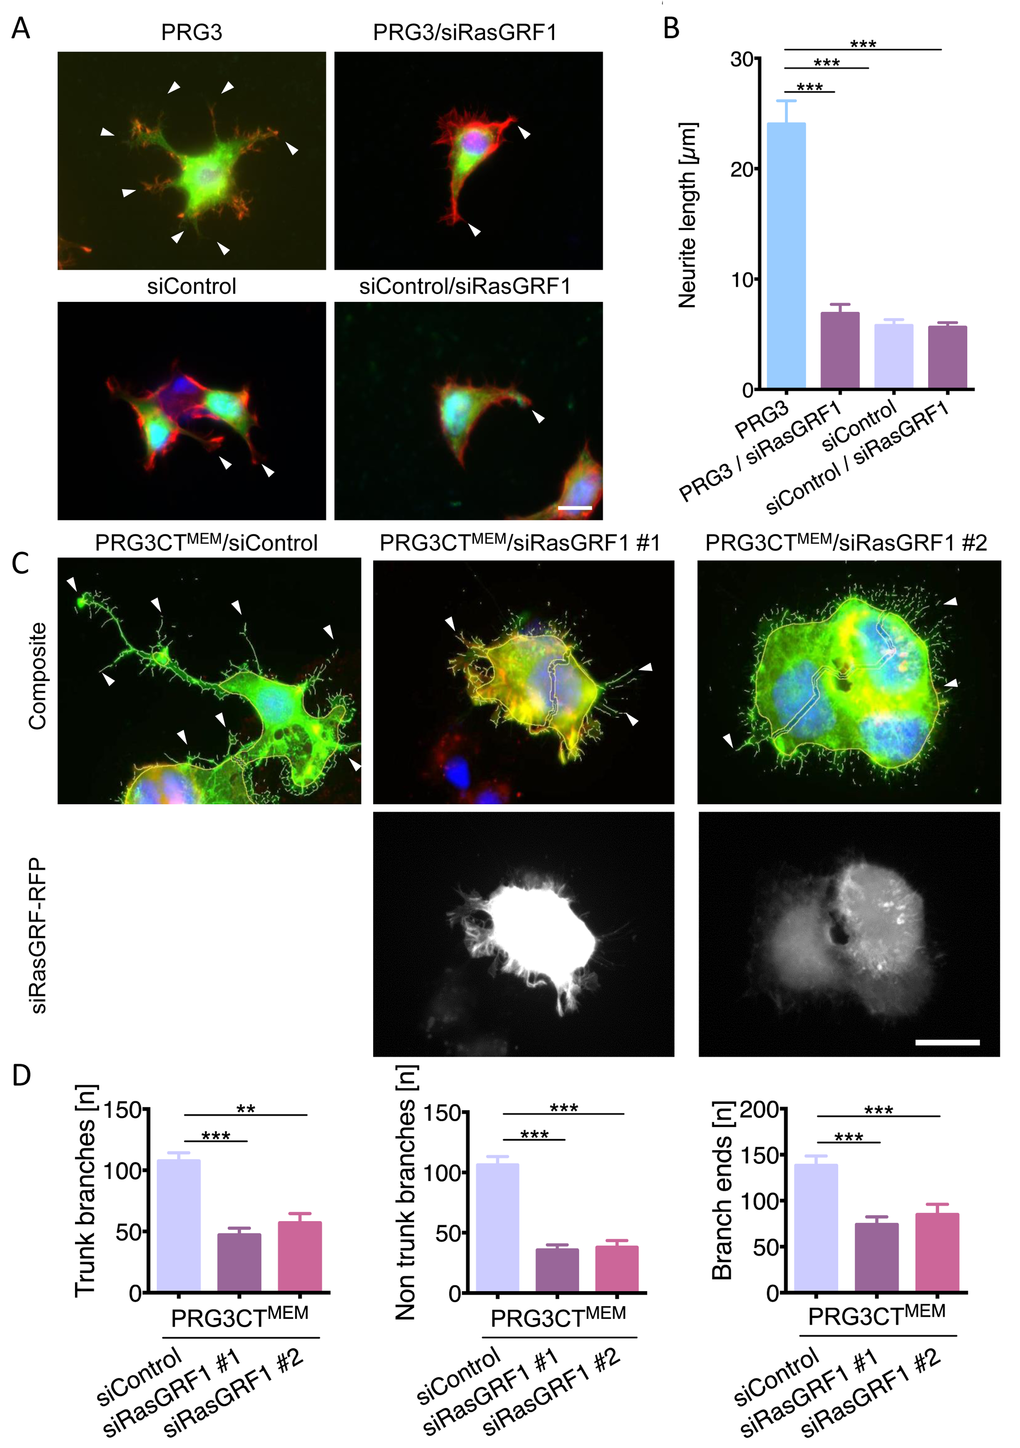
Figure 4.RasGRF1 executes PRG3-induced neuronal sprouting and elongation. (A) Representative images of siRNA mediated knockdown of RasGRF1 and PRG3. Top panel, PRG3 transfected cells show massive neurite sprouting (arrows, left). siRNA mediated knockdown of RasGRF1 in PRG3 overexpressing cells (PRG3/siRasGRF1) show reduced sprouting and membrane protrusions (arrowheads, right). Bottom panel, siRNA mediated knockdown of RasGRF1 (right) does not affect the morphology of controls (scrambled siRNA-transfected cells, left, arrows). Scale bar gives 20 µm. (B) Quantification of neurite length in neurons overexpressing PRG3 (PRG3), PRG3 overexpressing and silenced RasGRF1 (PRG3/siRasGRF1), control transfected (siControl) and control transfected and RasGRF1 siRNA knockdown (siControl/siRasGRF1). Statistical differences are calculated from three independent experiments tested with one way anova with Bonferroni post hoc analysis for multiple group comparisons. Values are given as mean ± SEM, * p <0.05, ** p<0.01, *** p<0.001. (C) Representative images of control shRNA (siControl) and two different RasGRF1 RFP-shRNA knockdown vectors (siRasGRF #1 and siRasGRF #2) in PRG3CTMEM expressing neurons show reduced filopodia formation and neurite outgrowth (arrowheads). Scale bar represents 20 µm. (D) Quantification of neuronal morphology in PRG3CTMEM expressing and siRNA mediated RasGRF1 knockdown cells. Neurons were analysed for number of branches at the soma (trunk branches), peripheral branches (non-trunk branches), and tip structures (branch ends). Differences were considered statistically significant with * p<0.05, ** p<0.01, *** p<0.001 (one way anova, Bonferroni post hoc analysis for multiple comparisons). Values are given as mean ± SEM from three independent experiments.