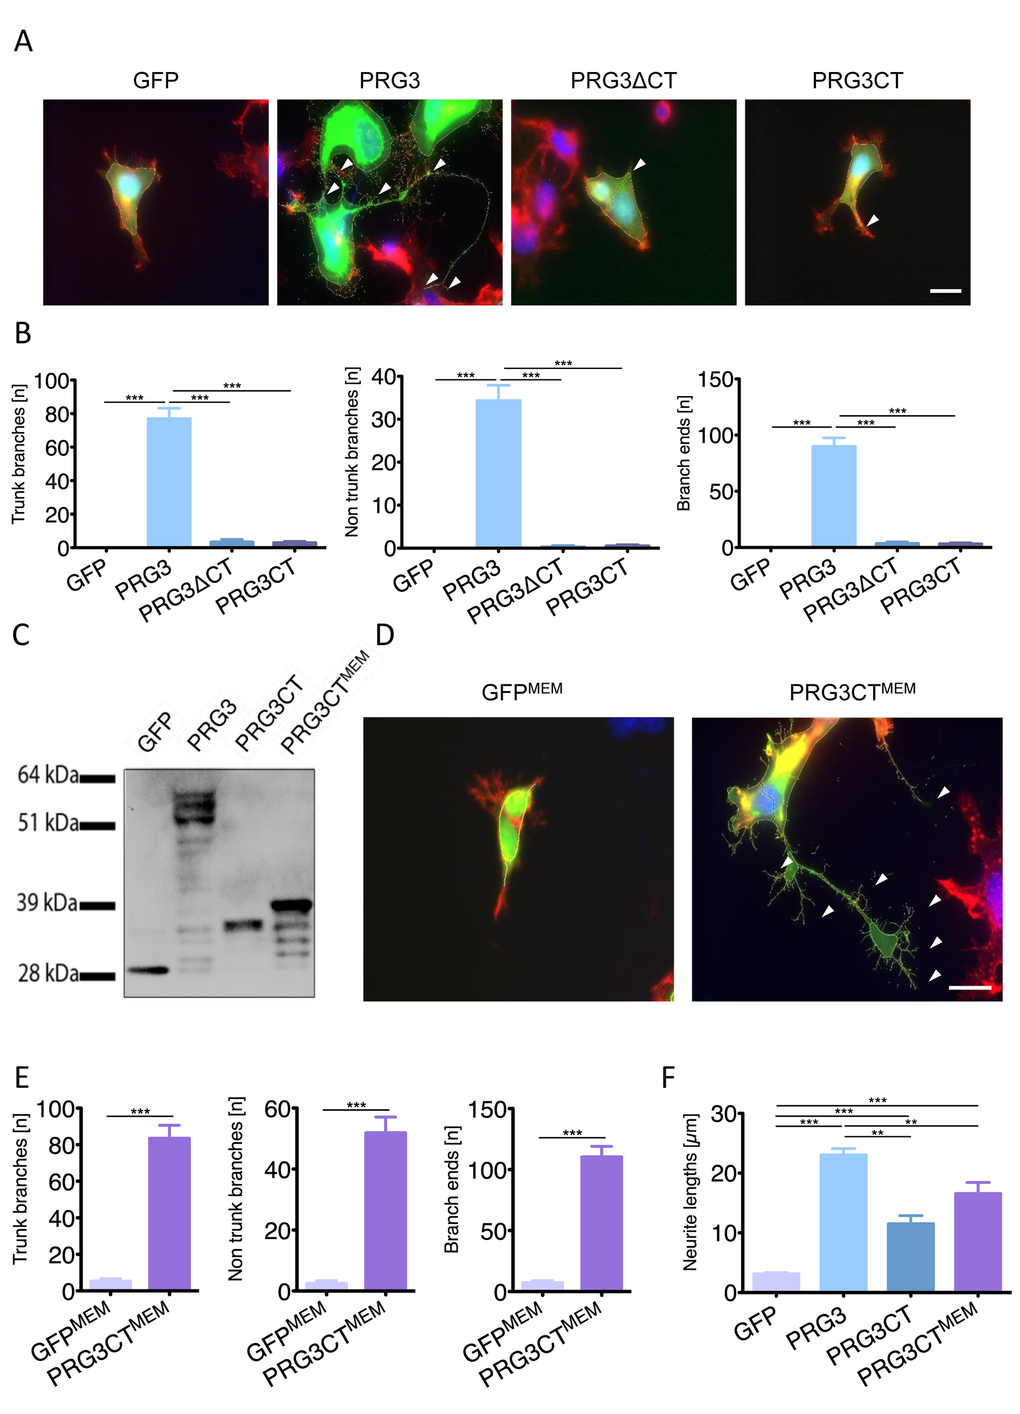
Figure 3.Plasma membrane localization of the PRG3 C-terminal domain is essential for axon outgrowth. (A) PRG3 overexpression induces neurite outgrowth (PRG3, arrows) in comparison to controls (GFP). A truncated PRG3 construct of its C-terminal domain (PRG3ΔCT) and a truncated PRG3 construct consisting of solely the C-terminus (PRG3CT) was compared. Expression of PRG3ΔCT and PRG3CT induces solely a few neurites comparable to controls arrowheads). Scale bar represents 20 µm. (B) Quantification of trunk, non-trunk branches and branch ends in controls (GFP), PRG3, PRG3ΔCT and PRG3CT. Data are given as mean ± SEM from three independent experiments. Statistical differences were analysed by one way anova with Bonferroni post hoc analysis. P value was set as * = p<0.05: ** = p<0.01; *** = p<0.001. (C) Total cell lysates from neuronal cells transfected with GFP or GFP fusion constructs, PRG3, PRG3CT, and PRG3CTMEM were examined by immunoblotting using GFP-specific antibody. PRG3CTMEM shows slight protein weight gain compared to PRG3CT due to the membrane myristoylation consensus tag (YES). (D) Comparison of membrane associated GFP (GFPMEM) and PRG3CTMEM in neuronal cells. Note the increase in neurites and filopodia in PRG3CTMEM expressing neurons compared to GFPMEM controls (arrowheads, scale bar shows 20 µm). (E) Quantification of axonal branches, non-trunk branches and branch ends of GFPMEM and PRG3CTMEM expressing neurons. Values are given from three independent experiments and statistical analysis was performed using two tailed student’s t-test. Error bars are given as ± SEM from three independent experiments of each group. (F) Comparison of total neurite length between different expression clones. Statistical analysis was performed one way anova with Bonferroni post hoc analysis for multiple comparisons; * p<0.05, ** p<0.01, *** p<0.001. Error bars are given as ± SEM of each group.