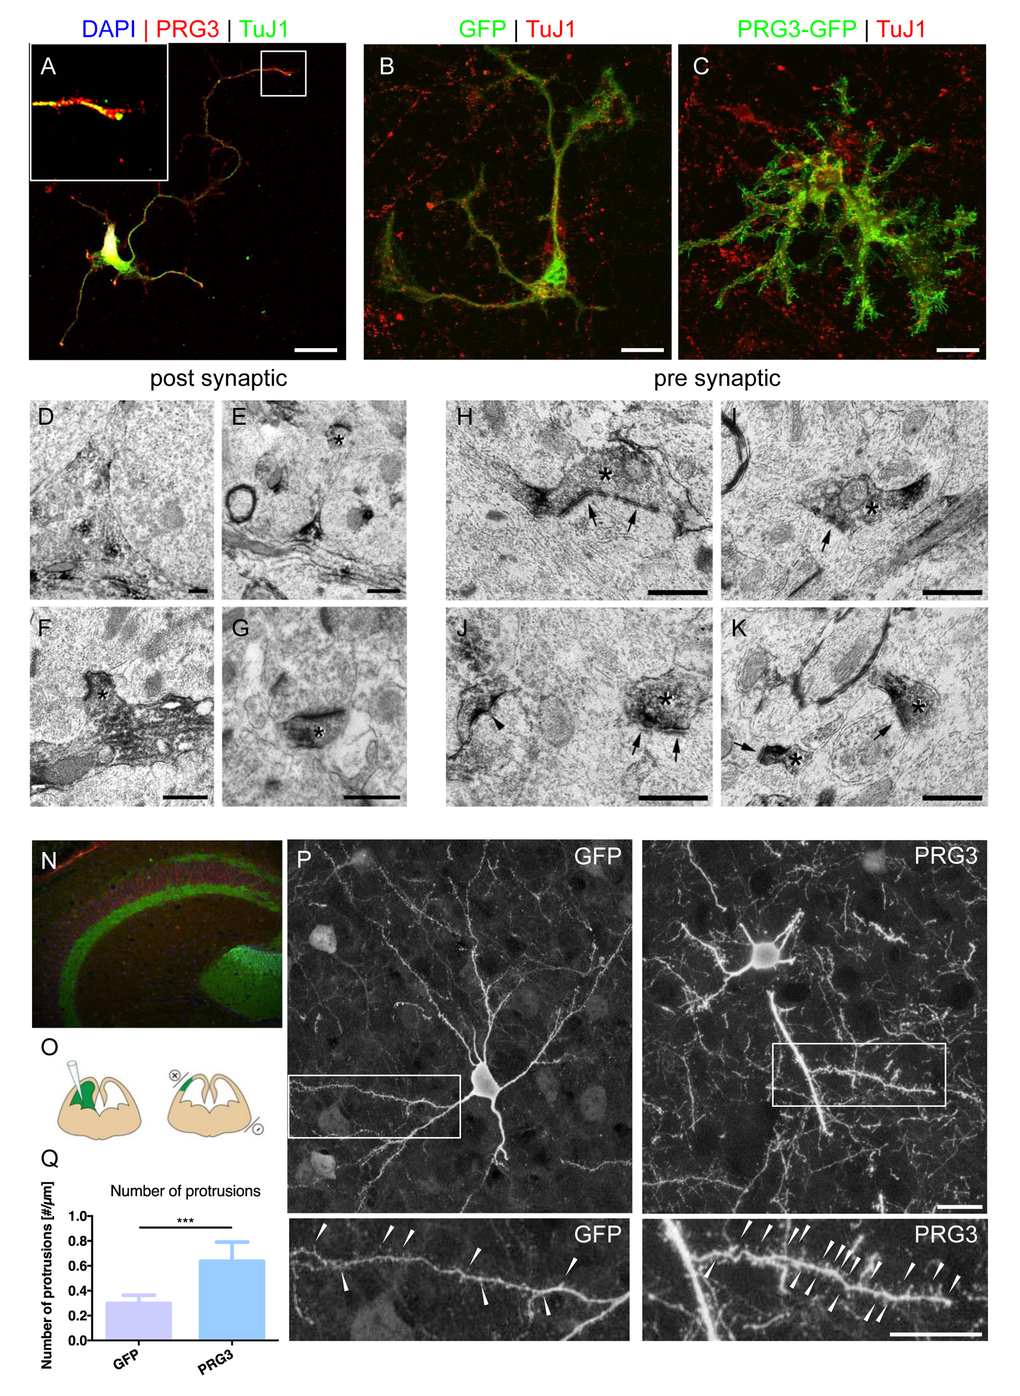
Figure 2.PRG3 is located at pre-synaptic domains in vitro and in vivo. (A) Endogenous PRG3 (red colour) is located at the plasma membrane and accumulated in TuJ1 positive axonal processes (green) in rat cortical neurons. Scale: 20 µm. (B) GFP vector transfection of rat primary cerebellar granular cells does not significantly alter cell morphology. TuJ1 co-staining shows neuronal origin (red). Scale: 20 µm (C) PRG3 overexpression (green) in primary cerebellar granular cells induces and accelerate neuronal outgrowth compared to controls (GFP, green). TuJ1immunostaining is given in red. Scale: 20 µm. (D-G) Pre-embedding electron microscopy immunolocalization of PRG3. Subcellular analysis reveals post-synaptic distribution of PRG3. DAB accumulated in the cytoplasm (D). Dendritic spine structures were also found positive for PRG3 and are indicated by asterisks (E-G). Scales: 0.5 µm. (H-K) Occasionally, axonal boutons (pre-synaptic structures), appeared labeled with PRG3 antibodies (asterisk). Accumulations of DAB appeared especially in the pre-terminal parts of the axonal boutons. Postsynaptic elements are marked with arrows and a labeled spine with an arrowhead in J. Scales: 0.5 µm. (N) Immunohistochemical staining identifies endogenous PRG3 expression (green) is located primarily in the hippocampus in the adult mouse brain (Red = TuJ1). (O) Scheme of the experimental protocol for cortical in utero electroporation [55]. (P) Representative example of electroporated brain section showing pyramidal neurons positive for GFP expressing pyramidal neurons (left) and PRG3-positive pyramidal cells (right). Neuronal morphology was analysed at postnatal day 10 (P10). Scale bar represents 20 µm. High-power magnifications of boxed areas show spines and spine-like membrane protrusions, which are indicated by arrowheads. Scale bar represents 20 µm. (Q) Number of protrusions per µm dendrite were quantified in 70 µm confocal stacks. Neurons electoroporated with PRG3 show significantly more protrusions per µm compared to GFP electroporated neurons. Values are given as mean ± SEM. (N=5). Statistical analysis was performed using two tailed student’s t-test. P value was set as * = p<0.05: ** = p<0.01; *** = p<0.001..
Figure 2 — Plasticity Related Gene 3 (PRG3) overcomes myelin-associated growth inhibition and promotes functional recovery after spinal cord injury | Aging