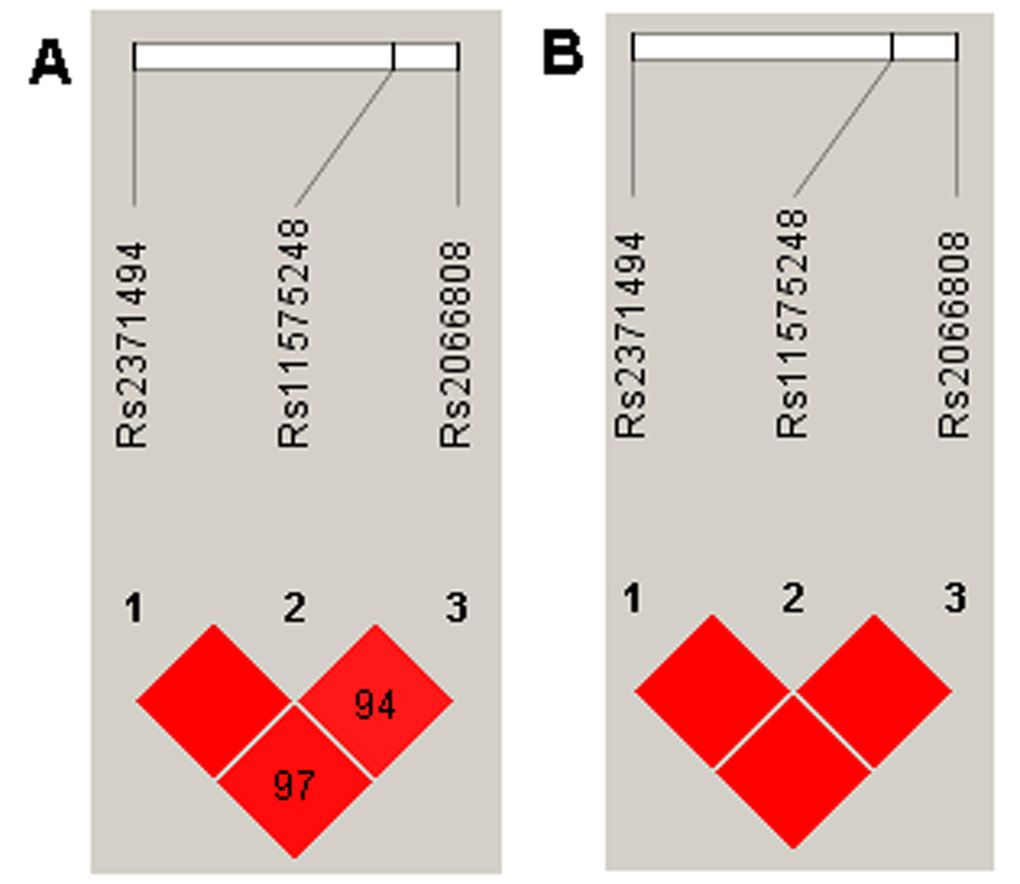
Figure 1.LD analysis of the variants in the IL23A gene region, and the LD plots were generated using the Haploview software v4.2. (A) Data analysis between IDD patients and controls from the present study. (B) Data from the HapMap CHB. The data from the HapMap CHB and this work were very similar.