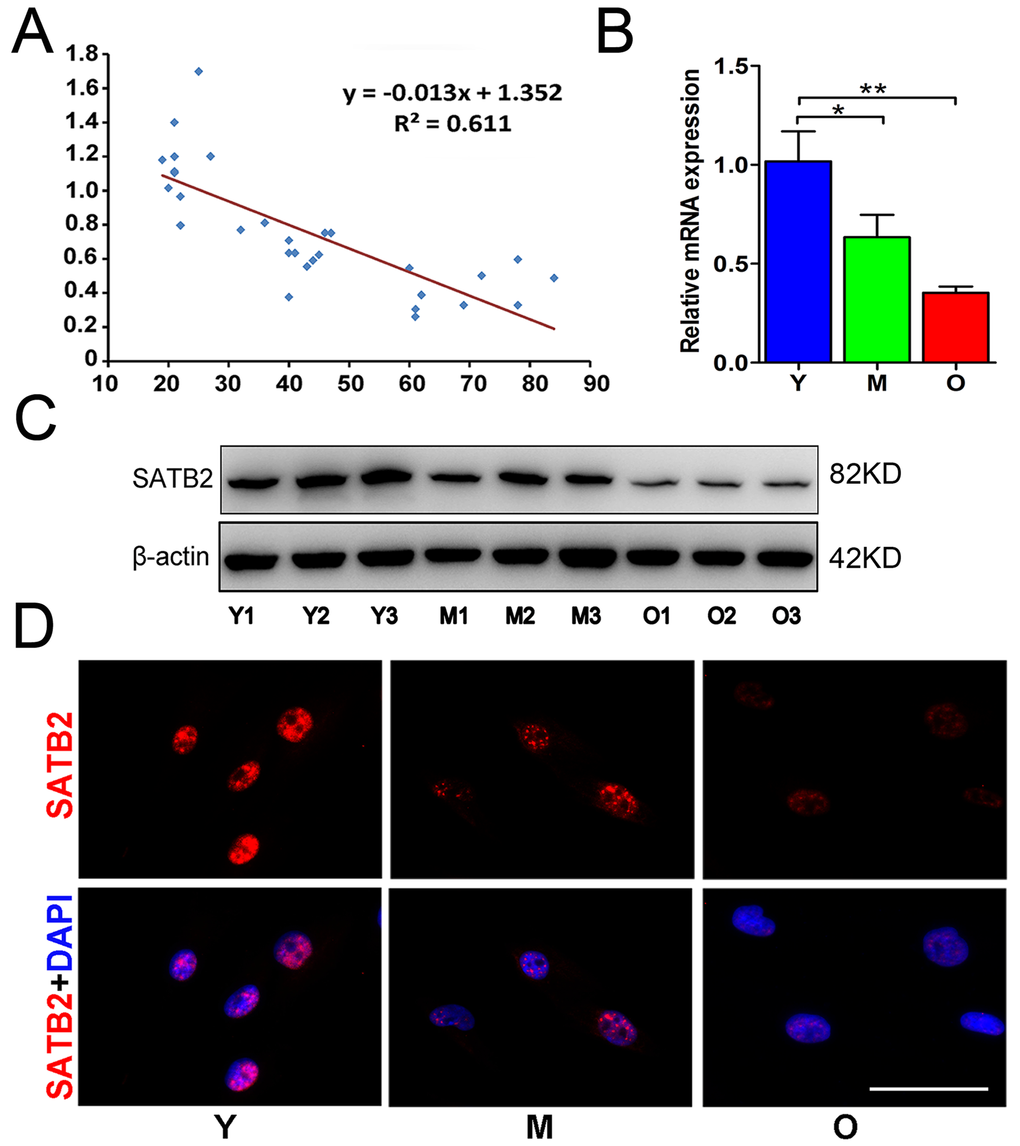
Figure 1.SATB2 expression in AB-BMSCs declines with age. (A) Correlogram showed inverse correlation between SATB2 expression and age. SATB2 mRNA (B) and protein (C) levels decreased with age. (D) Immunofluorescence of AB-BMSCs in different ages demonstrated decreased SATB2 expression with aging. *p < 0.05, **p< 0.01. Scale bar=100μm.