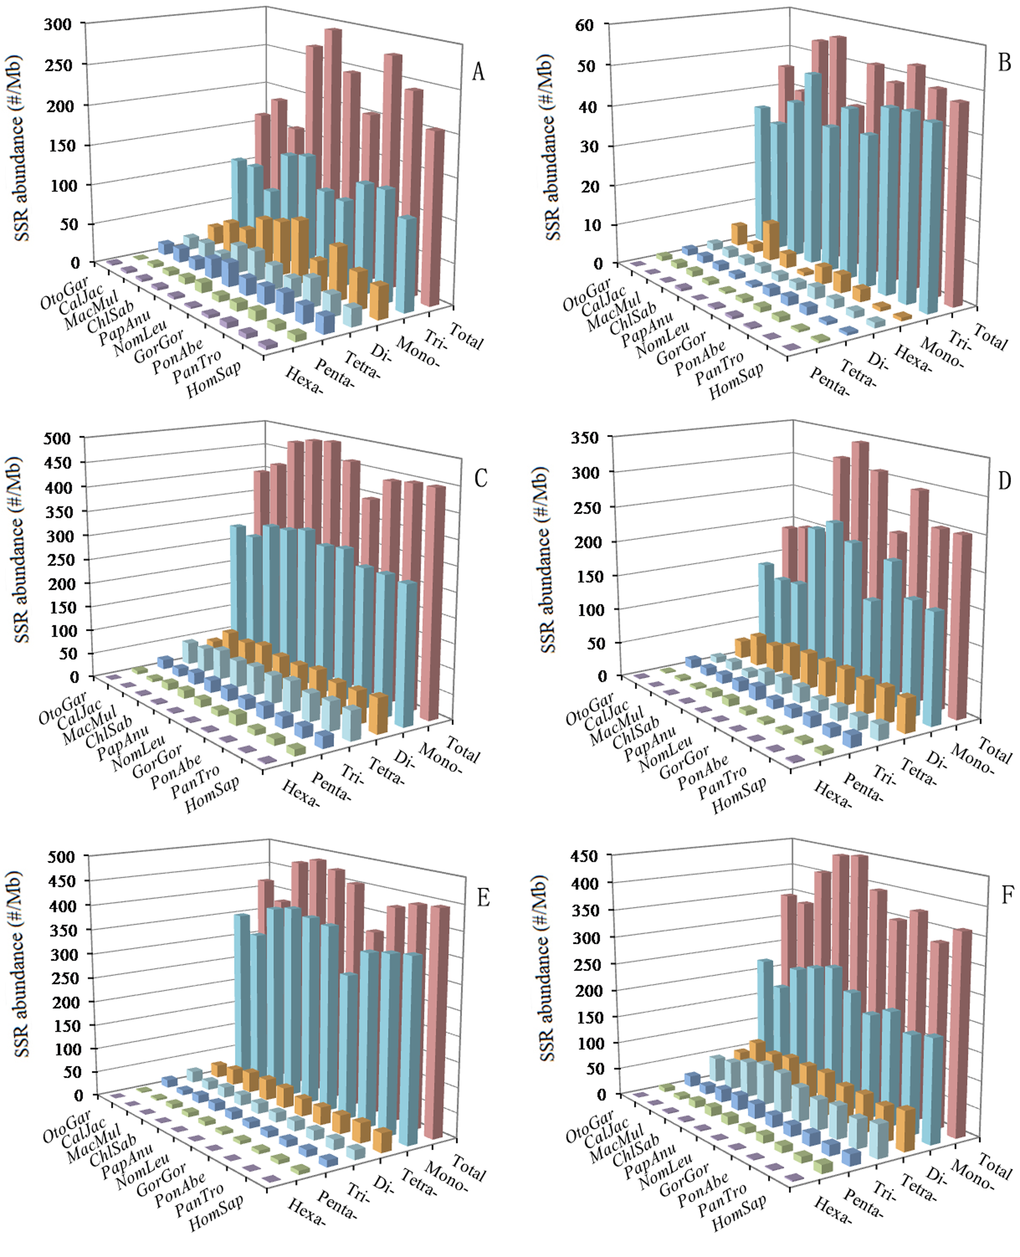
Figure 4.Relative abundance of mono- to hexanucleotide P-SSRs in different intragenic and intergenic regions of ten primates. ABCDEF represent 5'UTRs, CDSs, introns, 3'UTRs, TEs, and intergenic regions, respectively.
Figure 4 — Distinct patterns of simple sequence repeats and GC distribution in intragenic and intergenic regions of primate genomes | Aging