Submit an Article
Navigate
Home
Editorial Board
Editorial Policies
Current Volume
Archive
Scientific Integrity
Publication Ethics Statements
Interviews with Outstanding Authors
Newsroom
Sponsored Conferences
Podcast
Contact
Special Collections
Submit an Article
Online ISSN: 1945-4589
Research Paper
|
Volume 8, Issue 11
|
pp. 2635–2654
Distinct patterns of simple sequence repeats and GC distribution in intragenic and intergenic regions of primate genomes
Back to article
Figure 3
(3 of 6)
−
100%
+
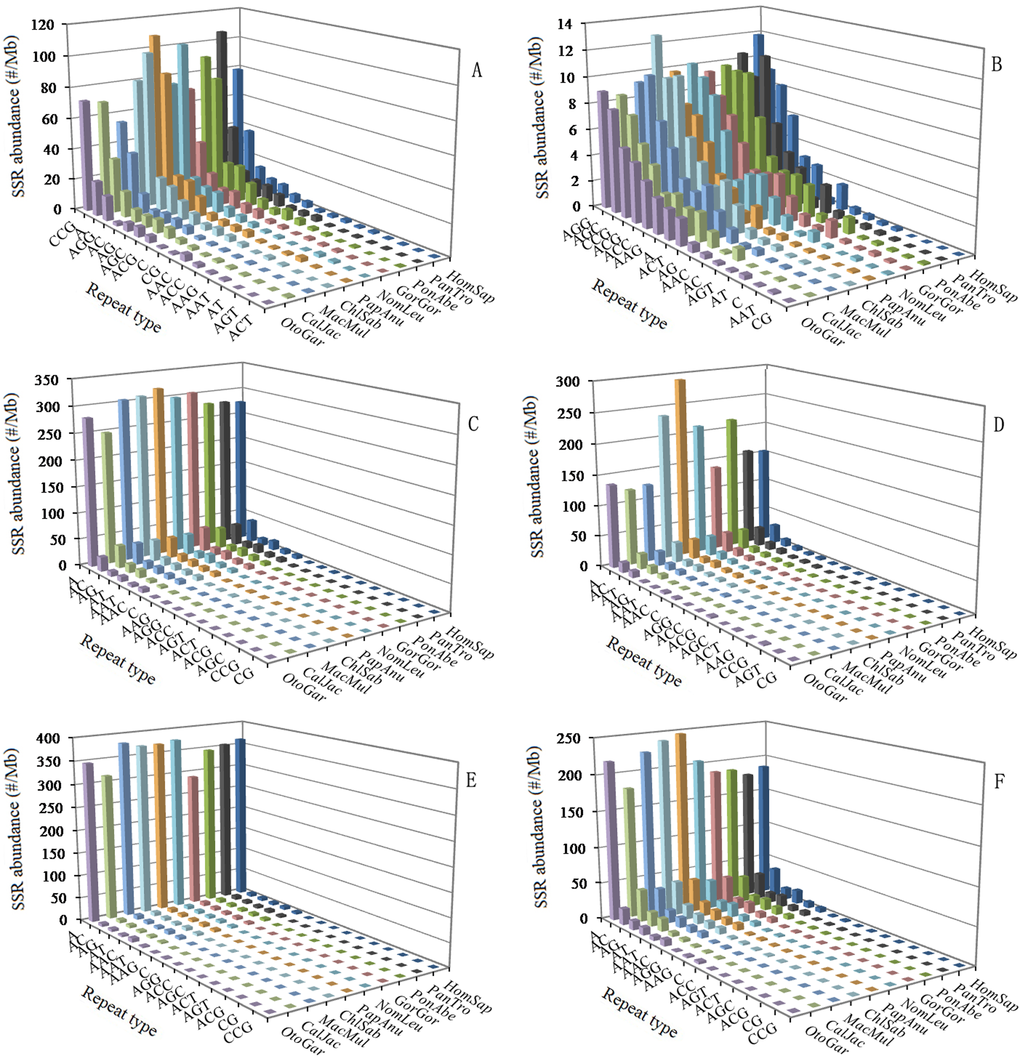
Figure 3.
Relative abundance of mono- to trinucleotide P-SSRs in different intragenic and intergenic regions of ten primates.
ABCDEF represent 5'UTRs, CDSs, introns, 3'UTRs, TEs, and intergenic regions, respectively.