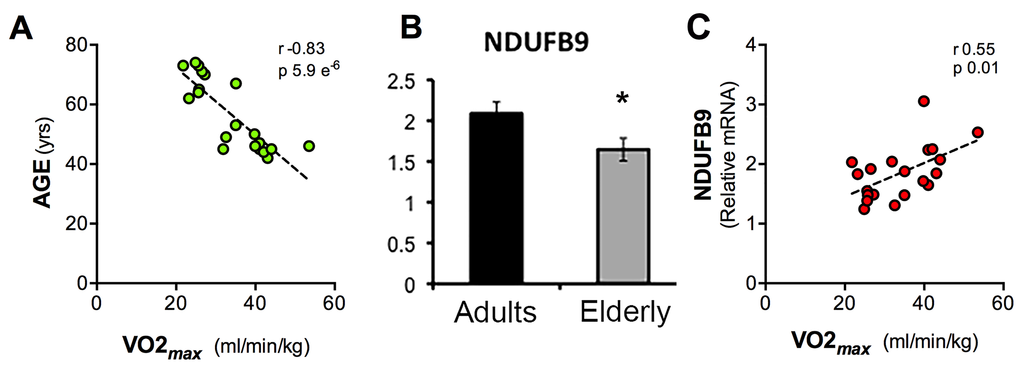
Figure 4.Scatter charts of values of Age, VO2max and NDUFB9 expression levels. Graphical representation of the correlation between VO2max and Age (A), expression levels of NDUFB9 assessed by qPCR and normalized against GAPDH (B), correlation between or VO2max and NDUFB9 gene expression levels detected by qPCR (C). (Pearson correlation, p = 5.9 e-6; r = 0.83 (A), p = 0.01; r = 0.55 (B), error bars, SEM * p < 0.05).