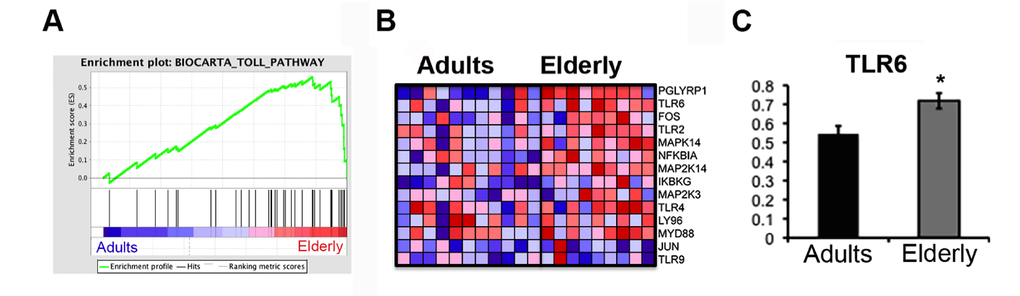
Figure 3.The Toll Pathway gene set is enriched in the Elderly group. Gene set enrichment analysis (GSEA) was performed with microarray data. (A) Enrichment plots for the Biocarta Toll Pathway gene set are shown. Genes related to the Toll Pathway most strongly associated with the Elderly phenotype are represented on the far right. (B) The heatmap shows the relative gene expression (red = high, blue = low) for each gene of the core enrichment for the samples of the two groups (Adults, Elderly). (C) qPCR analysis of the expression levels of the TLR6 gene in samples from the Adult (n=11) and Elderly (n=9) groups. Data were normalized against GAPDH housekeeping gene. Error bars, SEM. * p < 0.05.