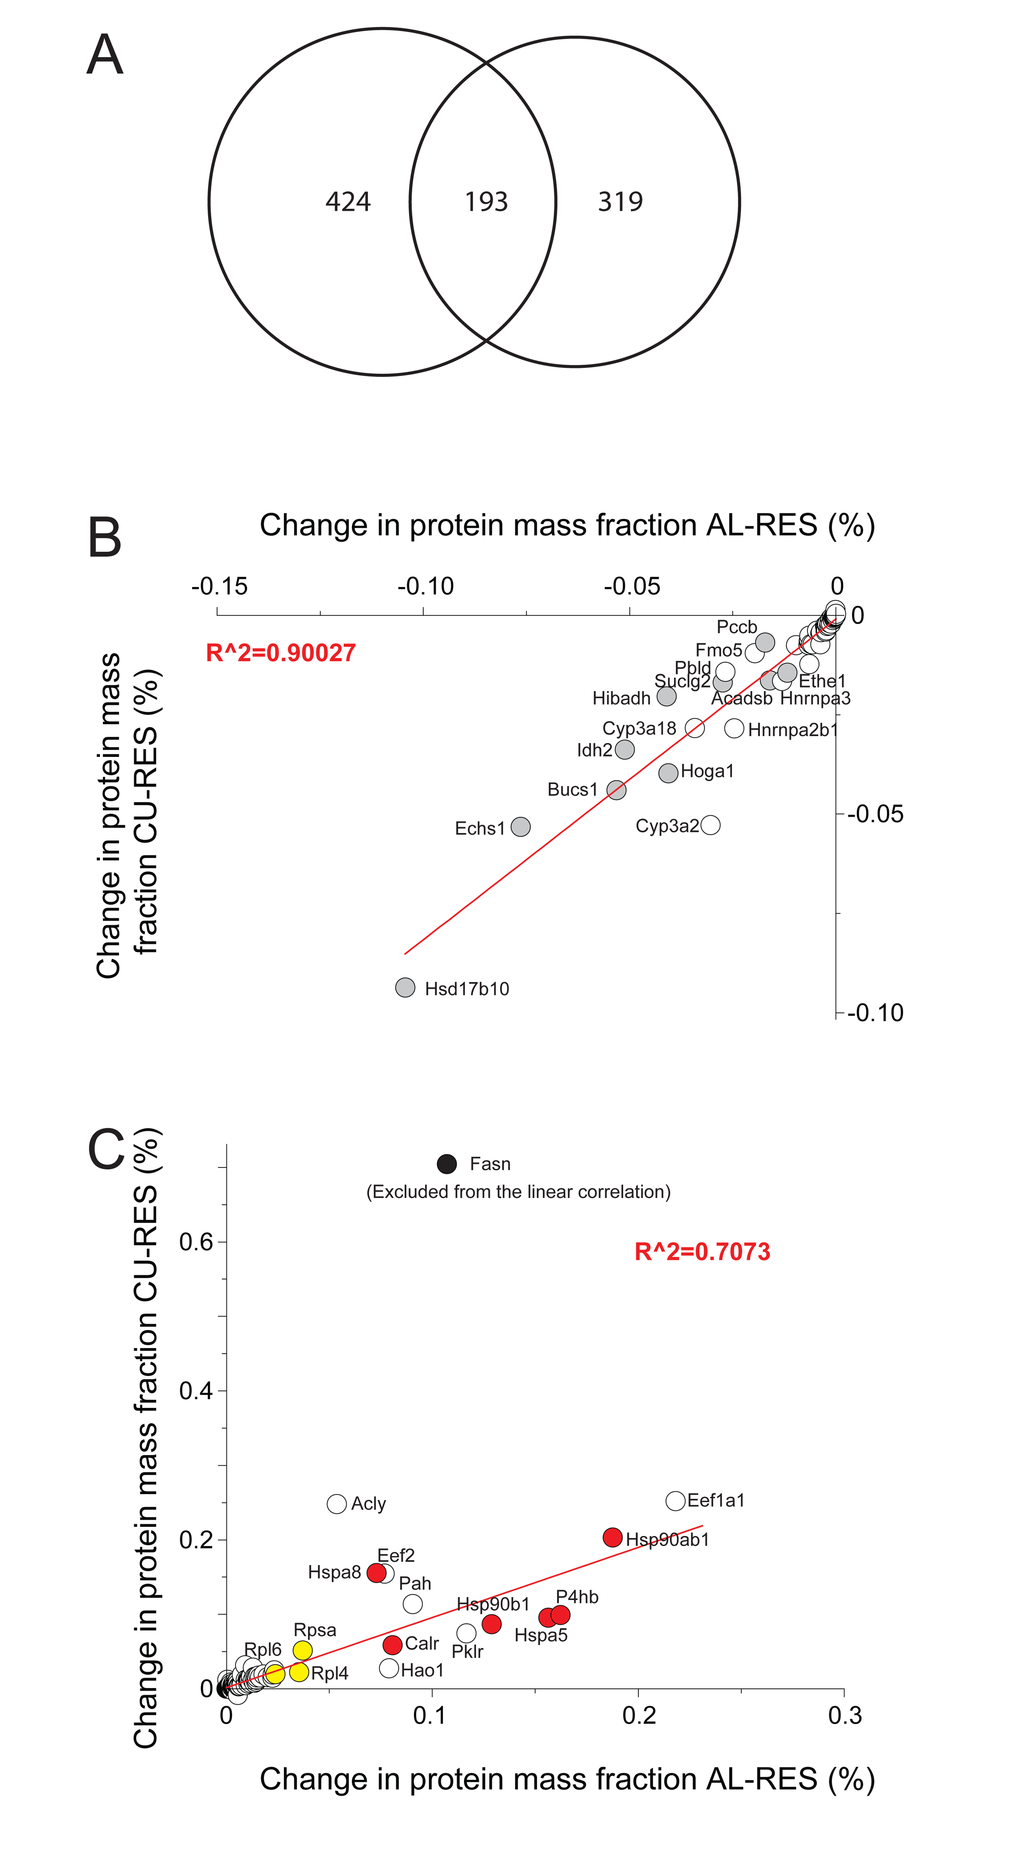
Figure 4.Differences in protein masses between RES, AL and CU regimes. (A) Venn diagram showing the 617 proteins, whose mass was significantly different between RES and AL (left) and the 513 proteins whose mass became significantly changed during one day of RES to CU transition (right). 193 proteins (center) varied significantly in both comparisons. (B) Proteins whose mass proportions were significantly higher in RES than in AL and CU. (C) Proteins whose mass proportions were significantly lower in RES than in AL and CU. Grey, mitochondrial proteins. Red: chaperone proteins. Yellow: ribosomal proteins. White: others.