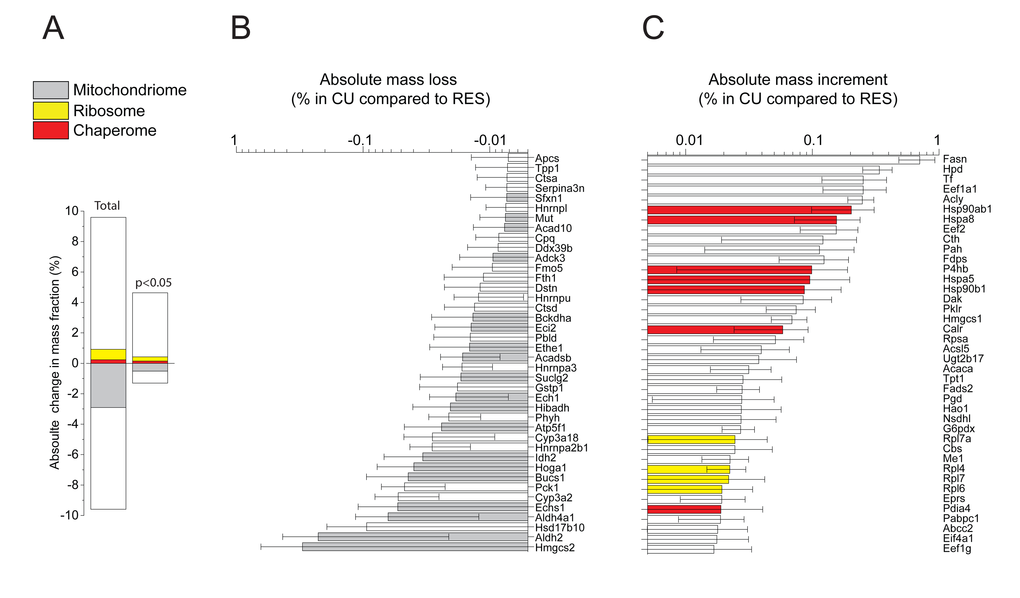
Figure 3.Net changes in protein masses between CU and RES. (A) Sum of relative mass gains and losses in CU as compared to RES. Left: only proteins with significant (P<0.05) mass differences. Right: All detected proteins. (B) Net absolute mass losses of the 40 most depleted proteins in CU. (C) Net absolute mass gains of the 40 most accumulated proteins in CU. Grey, mitochondrial proteins. Red: chaperome proteins. Yellow: ribosomal proteins. White: others.