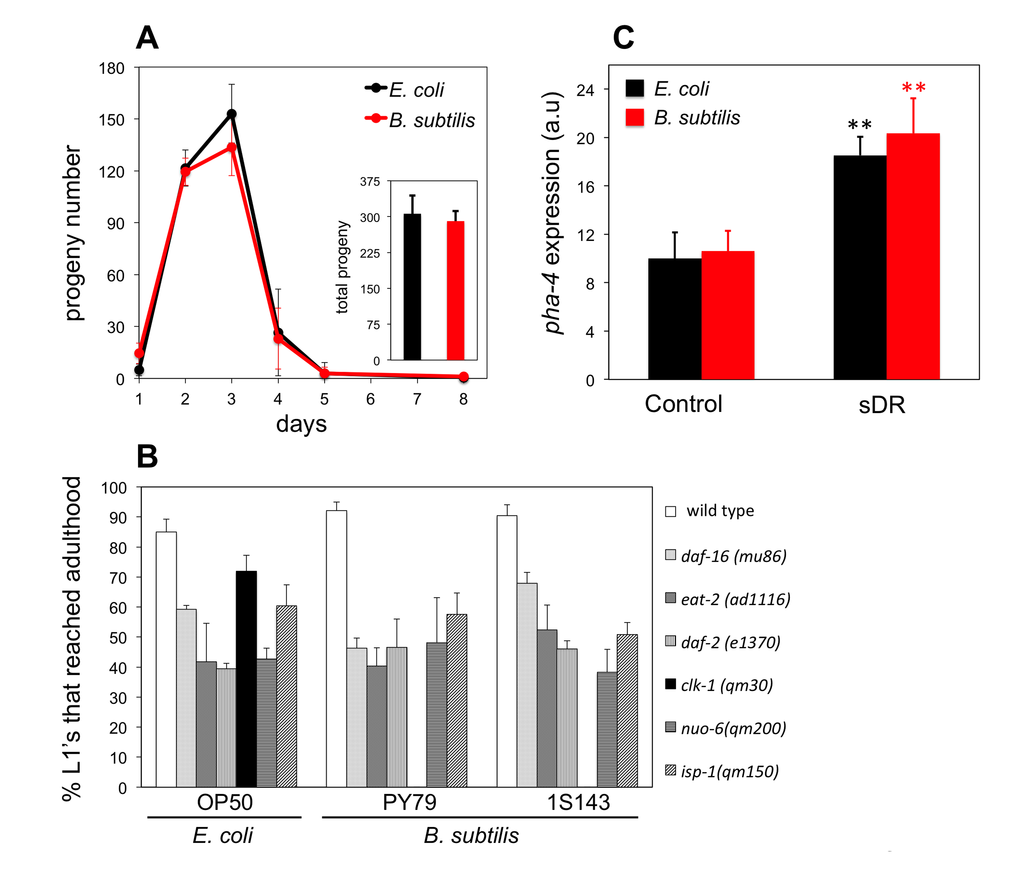
Figure 2.B. subtilis fed worms are not dietary restricted. (A) Daily average number of progeny ± S.E.M per worm and diet (n = 5 for each group). Inset bars represent the total average progeny ± S.E.M per worm on E. coli and B. subtilis. y-axis shows progeny number. x-axis shows age of adult worms. No statistical differences for each diet and group were observed (p > 0.05, Student’s t test). (B) Percentage of L1 larvae that became adults when fed E. coli or B. subtilis, wild type (PY79) and spore-less mutant (1S143), after 2.7 days (wild type worms), 2.7 days (daf-16 worms), 2.9 days (eat-2 worms), 3.6 days (daf-2 worms), 3.2 days (clk-1 worms), 5.0 days (nuo-6 worms), 5.0 days (isp-1 worms). y-axis shows percentage of L1 larvae that reached adulthood. x-axis shows E. coli or B. subtilis fed worms. n = 44-160 worms per group. Bars indicate the mean value ± S.E.M. No statistical differences for each diet and group were observed (p > 0.05, Student’s t test) except for clk-1 worms. (C) pha-4::mCherry fluorescent marker expression for 2 day old adults exposed to plenty of food (Control) or dietary restricted (sDR). y-axis shows levels of fluorescent expression in arbitrary units. x-axis shows E. coli or B. subtilis fed worms. Bars indicate mean fluorescent marker expression ± S.E.M. n = 10-20 for each group (**p < 0.01, Student’s t test).