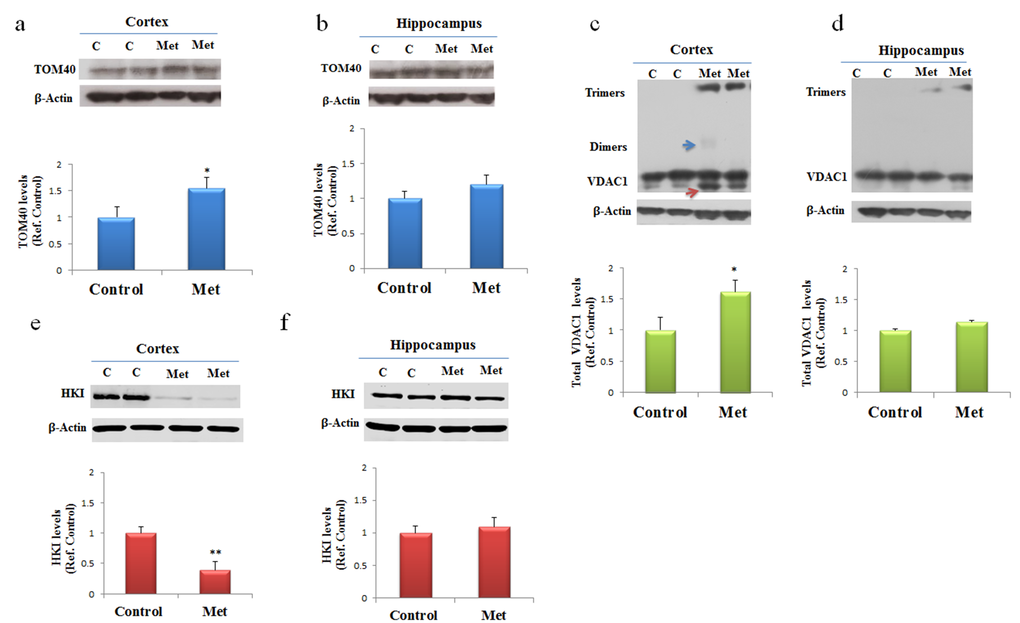
Figure 4.Metformin after chronic administration, changes TOM40 expression levels and induces VDAC1 oligomerization, and affects Hexokinase I (HKI) in the cortex region. Western blot of protein extracted from brain lysates of mice cortex (a, c, e) and hippocampus (b, d, f) after chronic metformin treatment and incubated with anti- TOM40, VDAC1, Hexokinase I (HKI), and β-Actin (loading control) antibodies. Quantitative analysis of total VDAC1, HKI and TOM40 levels relative to β-actin was performed using densitometric analysis. The blue arrow indicates a VDAC1 dimers and the red arrow indicates VDAC1 monomers with modified electrophoretic mobility. n=5 per group