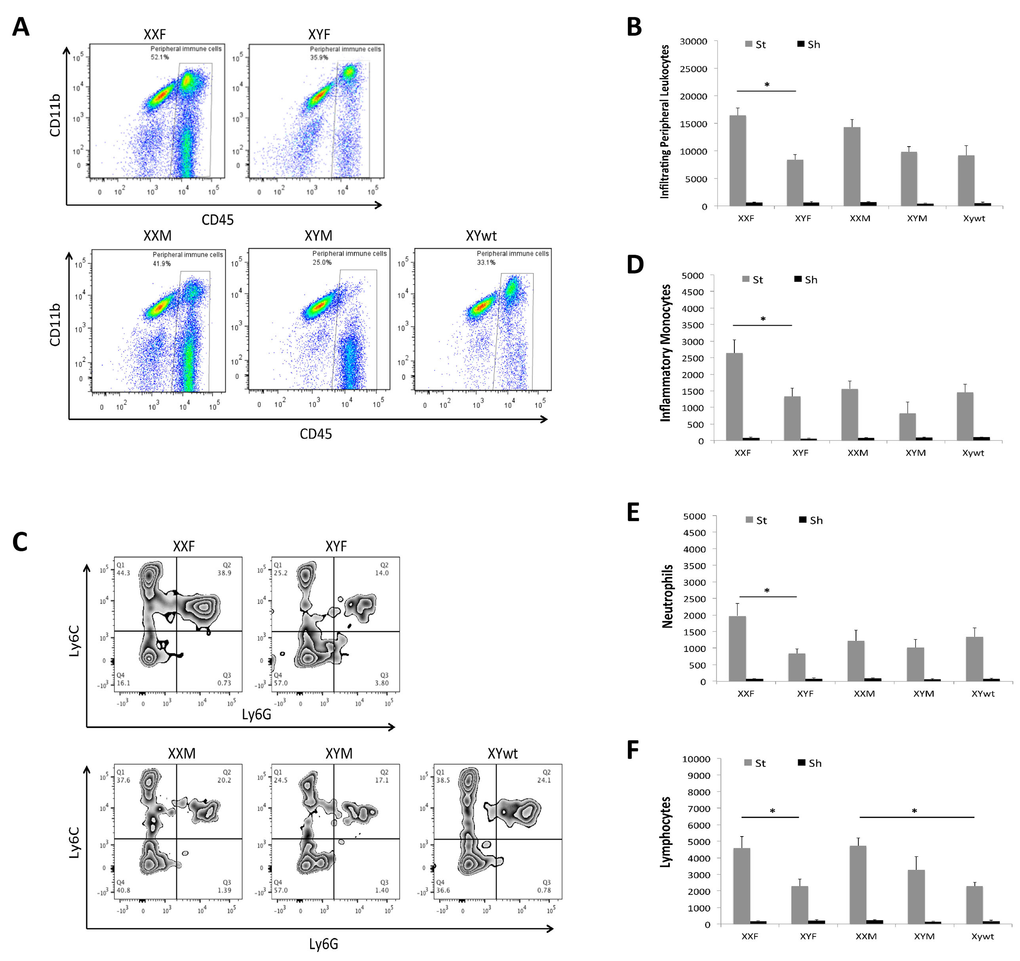
Figure 5.Infiltrating leukocytes in ischemic brains(A) Representative flow plots from each mouse strain showing gate strategy for infiltrating peripheral leukocytes (CD45high). (B) Total numbers of infiltrating peripheral leukocytes. (C) Representative plots indicating the percentage of inflammatory monocytes (Quardrant Q1) and neutrophils (Quardrant Q2) in infiltrating peripheral myeloid cells. Total numbers of each cell population were quantified in (D) monocytes, (E) neutrophils, and (F) lymphocytes. n=6/sroke group; n=3/sham group; *P < 0.05.