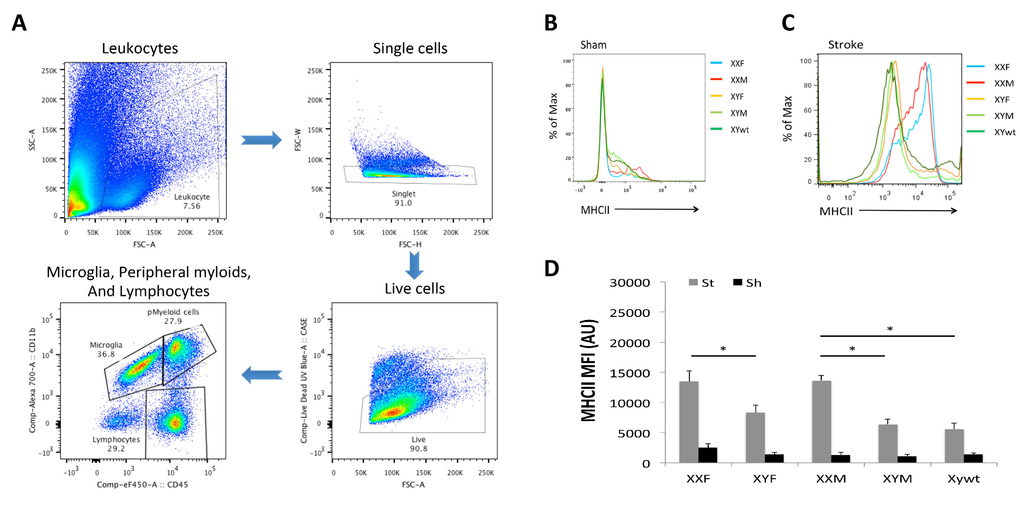
Figure 4.Microglial responses after stroke(A) Gating strategy indicating microglia as CD45lowCD11b+, peripheral myeloid cells as CD45highCD11b+, and lymphocytes as CD45highCD11b−. (B) and (C) Representative histograms showing MHC II expression on microglia in stroke and sham groups respectively. (D) Mean fluorescence intensity (MFI) of MHC II in each groups. n=6/sroke group; n=3/sham group; *P < 0.05.