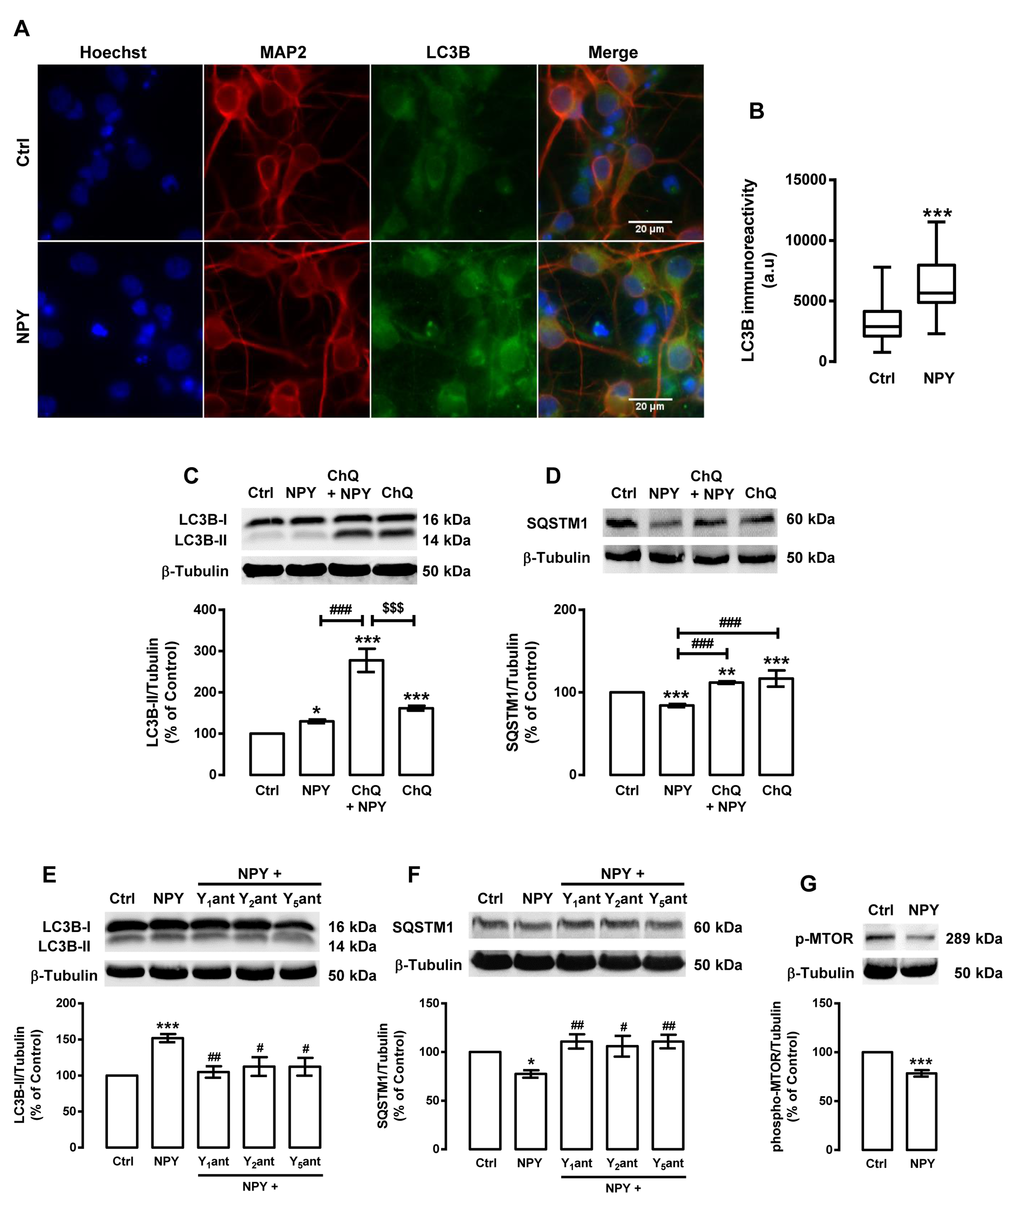
Figure 4.NPY increases autophagy in rat cortical neurons. Primary rat cortical neurons were exposed to NPY (100 nM) for 6 h. Untreated cells were used as control (Ctrl). (A) LC3B distribution was assessed by immunocytochemistry assay, as described in Materials and Methods. Cells were immunolabeled for LC3B (green) and MAP2 (red, neurons). Nuclei were stained with Hoechst 33342 (blue). Figures are representative of three independents experiments. Scale bar, 20 μM. (B) Quantification of the number of LC3B puncta immunoreactivity (green) per cell in each condition (>20 cells per group). ***p<0.001, significantly different compared to control, as determined by Student’s t test. (C-G) Cells were incubated with chloroquine (ChQ, 100 μM) (C and D), or with Y1 receptor antagonist BIBP3226 (Y1ant, 1 μM), Y2 receptor antagonist BIIE0246 (Y2ant, 1 μM) or Y5 receptor antagonist L152,800 (Y5ant, 1 μM) (E and F), 30 min before NPY (100 nM) . Whole cell extracts were assayed for LC3B-II (C and E), SQSTM1 (D and F), phospho-MTOR (p-MTOR) (G) and β-tubulin (loading control) immunoreactivity through Western blotting analysis, as described in Materials and Methods. Representative Western blots for each protein are presented above each respective graph. The results represent the mean ± SEM of, at least, five independents experiments, and are expressed as percentage of control. *p<0.05, **p<0.01 and ***p<0.001, significantly different compared to control; #p<0.05, ##p<0.01 and ###p<0.001, significantly different from NPY treatment; $$$p<0.001, significantly different from chloroquine-treated cells, as determined by ANOVA, followed by Bonferroni’s post test.