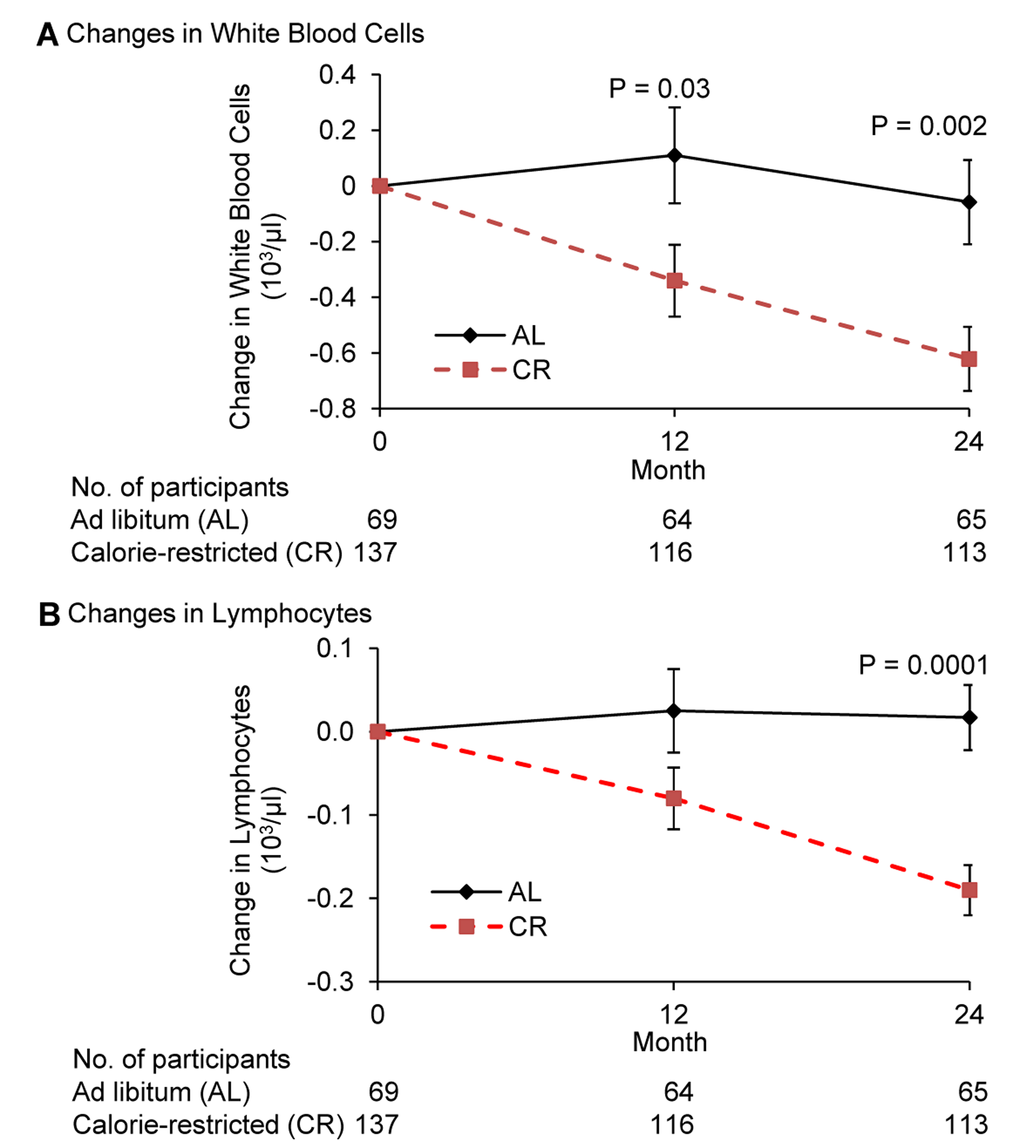
Figure 2.Change in the number of white blood cells and lymphocytes following 2 years of calorie restriction in humansPanel (A) baseline values of white blood cells for ad libitum (AL) and calorie-restricted (CR) groups were 5.9 × 10³/μl and 6.0 × 10³/μl, respectively. Panel (B) baseline values of lymphocytes for both AL and CR groups were 1.8 × 10³/μl. Data are mean (SE). The P value comparisons are for AL and CR groups at indicated time points.