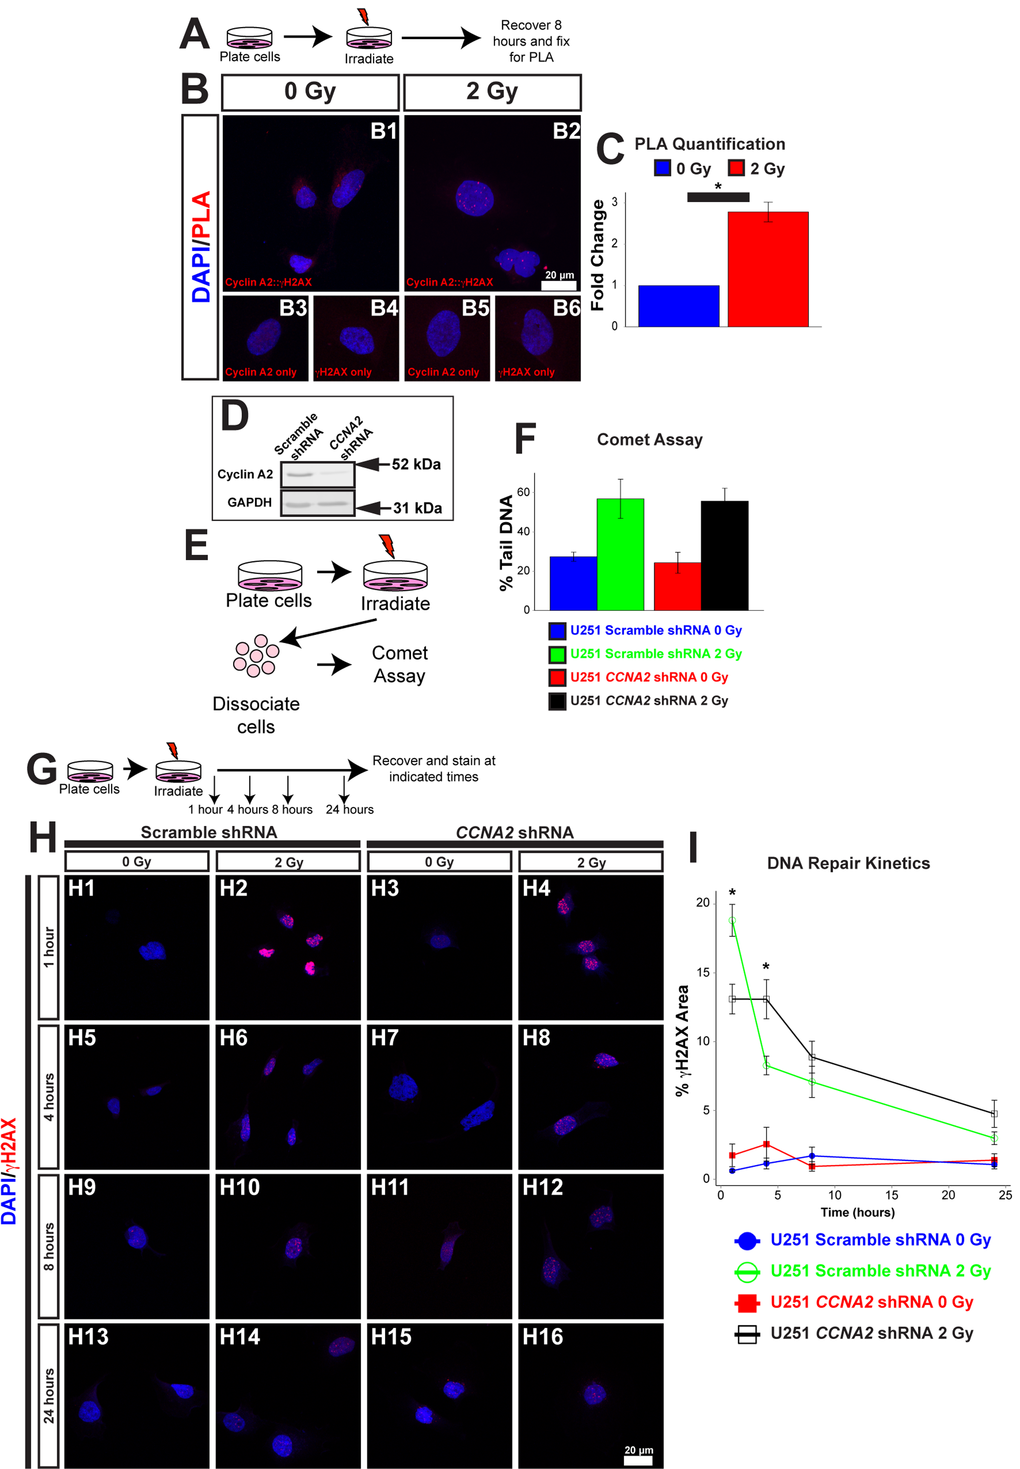
Figure 5.γH2AX is located at foci of DNA damage. (A) Schematic of experiment in (B) and (C). U251 cells were irradiated with 2 Gy. 8 hours after irradiation, cells were processed for PLA. (B) Association between Cyclin A2 and γH2AX. Positive PLA signals manifest as punctate foci in the nucleus. Single-labeled controls are presented below. Experimental conditions are indicated above, molecular markers are color-coded on the left. Antibodies used are indicated in each image. (C) Quantification of (B). The y-axis is fold-change of PLA signals induced by radiation. 2 Gy induces associations between γH2AX and Cyclin A2 approximately 3-fold. Unpaired t-test, * = p < 0.05, n=3 independent experiments, 45 total cells for 0 Gy condition, 44 total cells for 2 Gy condition. (D) Silencing of CCNA2 by shRNA confirmed by western blotting. (E) Schematic of comet assay. (F) Equivalent DNA damage after treatment with X-rays in CCNA2-silenced U251 cells. Comet assay was performed on cells with CCNA2 or scramble shRNA after treatment with 2 Gy X-rays. We did not observe a significant change in DNA damage (ANOVA, n=2). The y-axis shows percentage of DNA found in the tail of each comet. (G) Schematic of experiment in (H) and (I). U251 cells encoding either CCNA2-targeting or scrambled shRNA were irradiated with 2 Gy or mock-treated. Cells were allowed to recover and fixed the times indicated then stained for Rad51 and γH2AX. (H) Silencing CCNA2 reduces phosphorylation of H2AX after 2 Gy and slows DNA repair rates as measured by γH2AX signal as a percentage of the nuclear area. (I) CCNA2-silenced cells display decreased phosphorylation of H2AX and delayed DNA repair. The x-axis is the time after irradiation, and the y-axis is the area of each nucleus with γH2AX signal. ANOVA with Tukey’s HSD, * = p < 0.05 between the CCNA2 and scramble shRNA, n=3 independent experiments, 46-55 total cells per condition. Error bars for all graphs represent s.e.m.