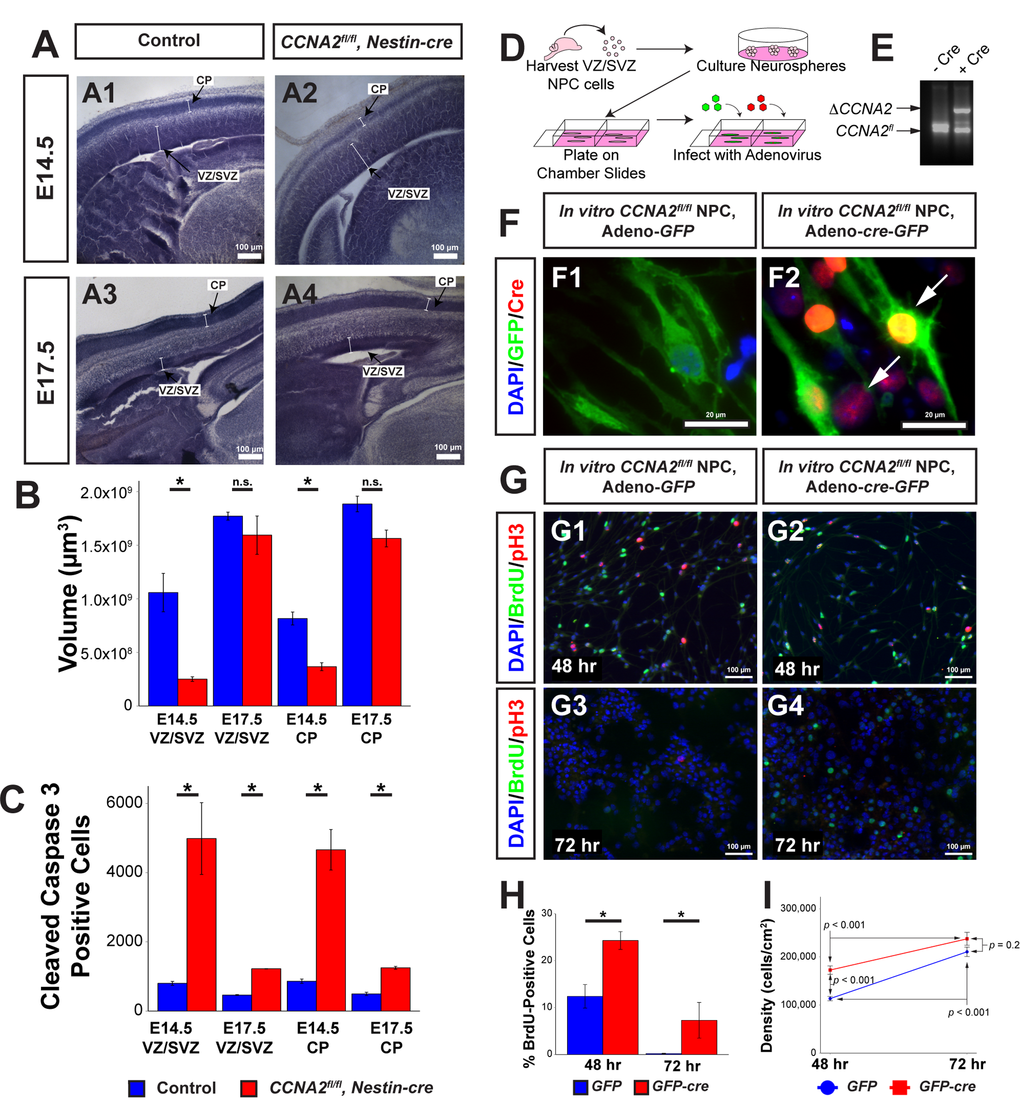
Figure 1.CCNA2 Loss delays embryonic forebrain development. (A) Representative low-magnification images used for unbiased stereology quantification. The VZ/SVZ and CP are noted by arrows. Experimental conditions are indicated above. (B) Total VZ/SVZ and CP volume. At E14.5, the volumes of both structures in CCNA2fl/fl, Nestin-cre animals were significantly reduced compared to controls. At E17.5, there was no statistical difference between groups. Quantifications represent Cavalieri unbiased stereology analysis of the entire brain. The y-axis is volume of the VZ/SVZ or CP. Unpaired t-test, * = p < 0.05, n.s. = not significant. For E14.5, n= 3 animals each for control and experimental groups. For E17.5, n=2 animals for control group and 3 animals for experimental group. (C) Total apoptotic cells in the VZ/SVZ and CP. At both ages, there was a significant increase in apoptosis in both structures. Quantifications represent Optical Fractionator unbiased stereology analysis of the entire brain at 100x magnification. The y-axis is total number of cleaved caspase 3-positive cells in the VZ/SVZ or CP. Unpaired t-test, * = p < 0.05. (D) Schematic of neural progenitor cell culture. Neural progenitors from the VZ/SVZ were dissected from P5 CCNA2fl/fl pups and cultured as neurospheres. Neurospheres were dissociated and infected with adenovirus encoding cre and GFP to excise CCNA2, or adenovirus encoding GFP only as a control. (E) CCNA2fl/fl ablation in vitro. DNA from infected cells was amplified by PCR. Alleles represented by each band are indicated on the left, and Cre condition is above. (F) Cells were stained for GFP and Cre recombinase. Infection of neural progenitor cells results in >90% infection. Arrows indicate Cre-positive cells in F2. (G) Cells were infected as shown in (F). Cells were pulsed with BrdU for 30 minutes before fixation 48 and 72 hours after plating. The proportion of BrdU and pH3-positive cells was increased in CCNA2-null cells. (H) Quantification of BrdU-positive cells 48 and 72 hours after plating. The x-axis is time after plating, and the y-axis is the percentage of cells that incorporated BrdU. Unpaired t-test, * = p < 0.05. (I) Quantification of cell density 48 and 72 hours after plating. Forty-eight hours after plating, CCNA2-null cells were less dense. There was no statistical difference between CCNA2-null and control cells 72 hours after plating. ANOVA with Tukey’s HSD, p values are noted on the plot. These data support that CCNA2-null neural stem cells are capable of reaching the carrying capacity of their respective stem cell niches. The x-axis is time after plating, and the y-axis is cell density. Error bars for all graphs represent standard errors of the mean (s.e.m.).