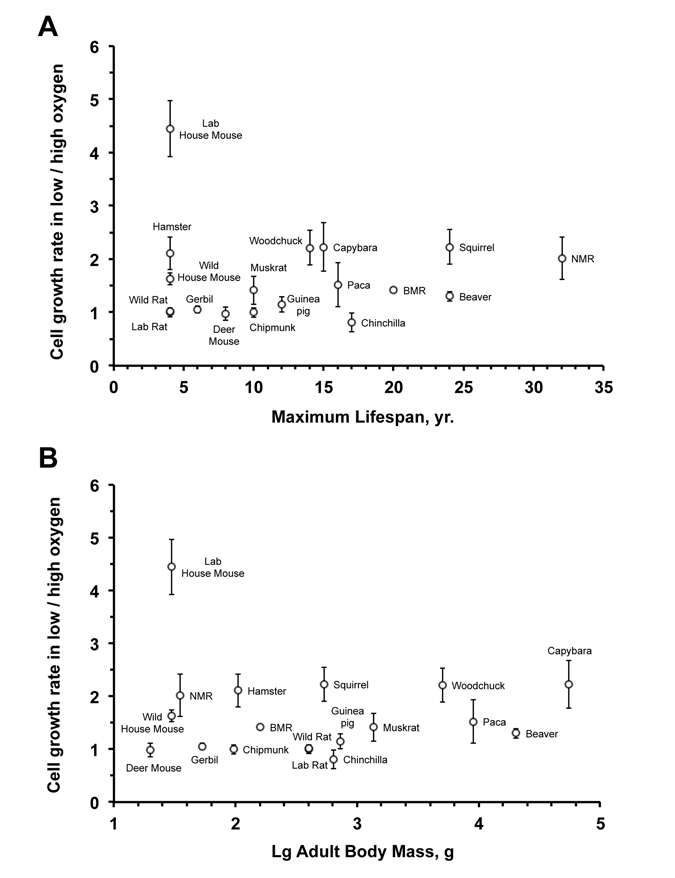
Figure 2.Fibroblast sensitivity to oxygen does not correlate with maximum lifespan (A) or body mass (B)The sensitivity to oxygen environment is reflected by the ratio between the growth rate at 3% and 21% oxygen. The rate of cell proliferation in 3% or 21% oxygen is the slope of the regression line shown in Figure 1. No significant correlation was observed between oxygen sensitivity and maximum lifespan (r2 = 0.0001; P = 0.97) or oxygen sensitivity and body mass (r2 = 0.006; P = 0.76). The correlation remained non‐significant after an outlier (laboratory mouse) was excluded: oxygen sensitivity and maximum lifespan (r2 = 0.135; P = 0.15); oxygen sensitivity and body mass (r2 = 0.075; P = 0.29).