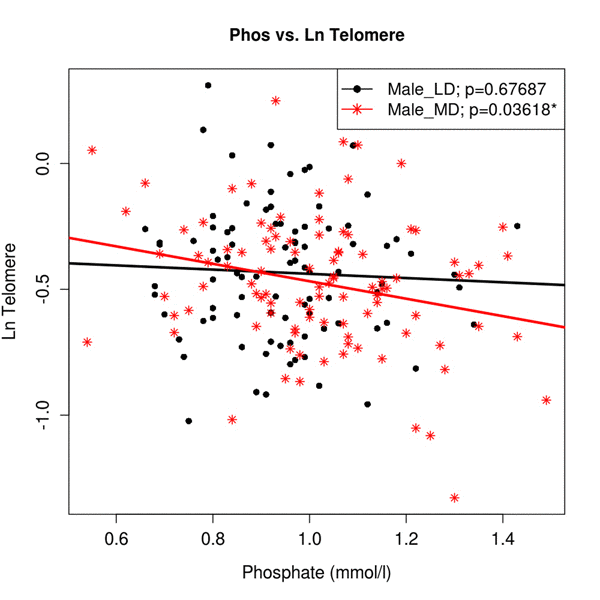
Figure 1.The association between Ln (Tl) and Pi in sub-samples of gender and deprivationRegression analysis of Pi levels versus telomere length adjusted for gender and deprivation status. Regression lines for males split by derivation status are colour coded and shown in the accompanying key. Male_LD - male least deprived, Male_MD - male most deprived.