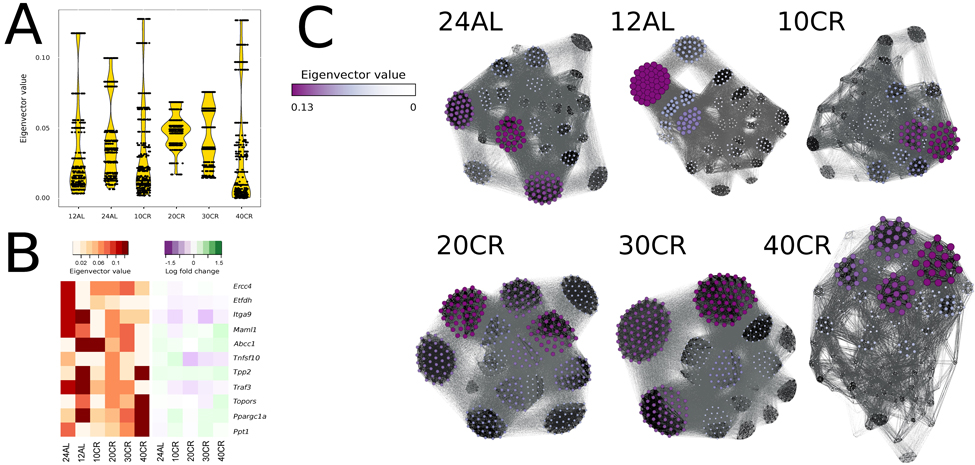
Figure 5.Node centrality was identified by calculating the eigenvector value for each gene in each conditional mutual information (CMI) network(A) Eigenvector distribution visualized in a violin plot per CR level. (B) Changes of eigenvector values and gene expression levels relative to 12h ad libitum feeding of key genes visualized in a heat map. (C) CMI networks at each CR level with node sizes and color proportional to eigenvector values. Edges between genes with strong CMI are colored in black, those with weak CMI in light grey. 24AL, 12AL, 10CR, 20CR, 30CR and 40CR refer respectively to 24h ad libitum feeding per day, 12h ad libitum feeding per day, 10 %, 20 %, 30 % and 40 % restriction.