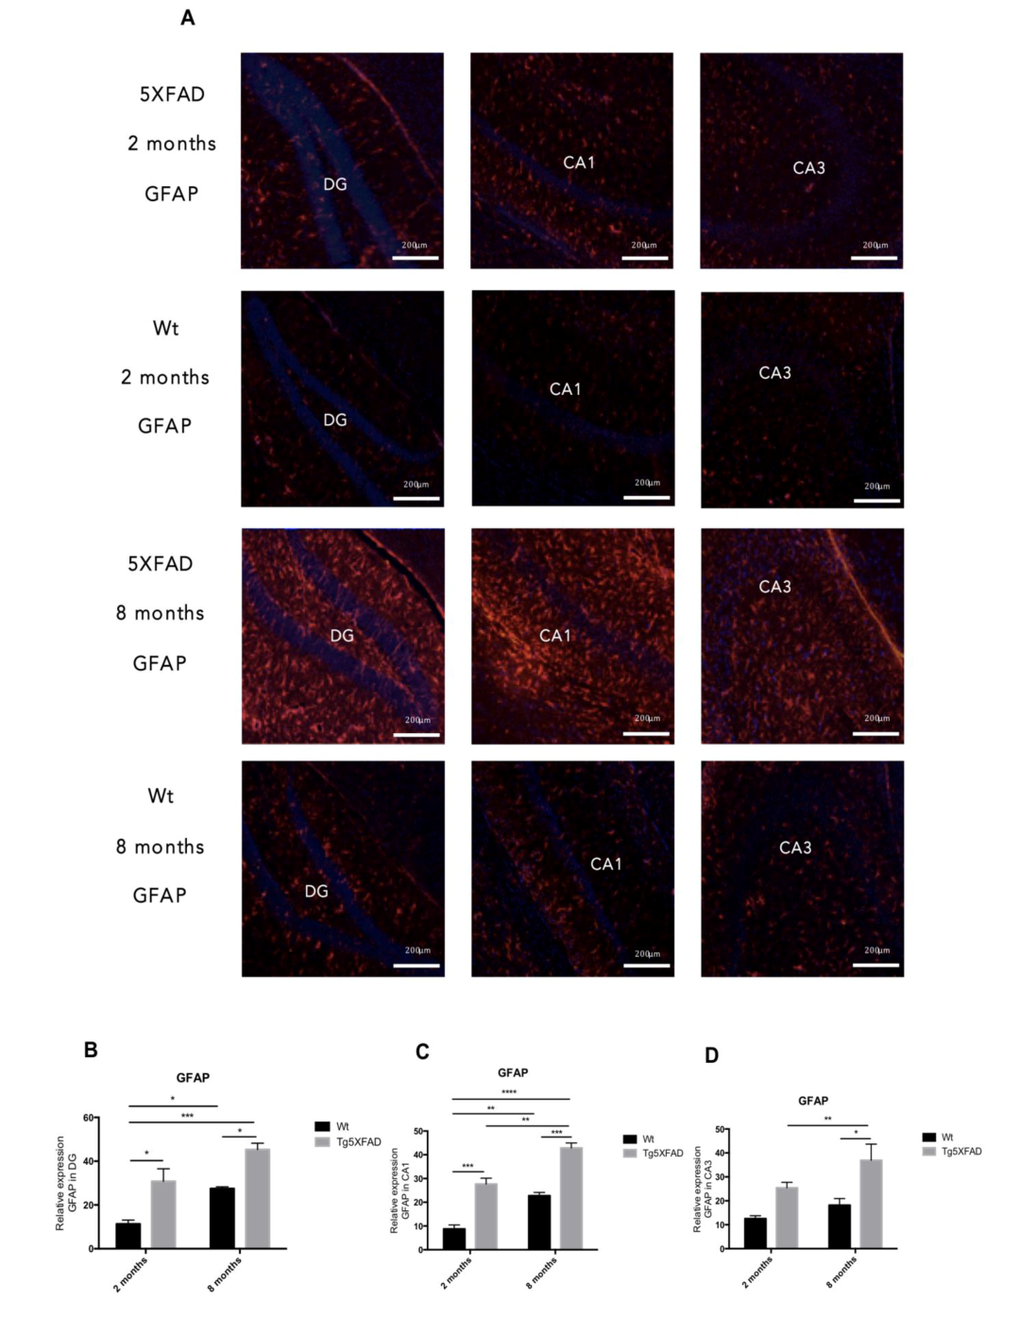
Figure 6.Representative images for GFAP immunostaining (A) and quantification on the bar chart (B-D) in female mice aged 2 and 8 months (Wt and 5XFAD). Bars represent mean ± Standard Error of the Mean (SEM); (n = 4 for each group). ***p<0.001; ****p<0.0001. DG: Dentate Gyrus. Scale bar for immunohistochemical images is 200 μm.