Submit an Article
Navigate
Home
Editorial Board
Editorial Policies
Current Volume
Archive
Scientific Integrity
Publication Ethics Statements
Interviews with Outstanding Authors
Newsroom
Sponsored Conferences
Podcast
Contact
Special Collections
Submit an Article
Online ISSN: 1945-4589
Research Paper
|
Volume 8, Issue 1
|
pp. 158–176
To senesce or not to senesce: how primary human fibroblasts decide their cell fate after DNA damage
Back to article
Figure 9
(9 of 9)
−
100%
+
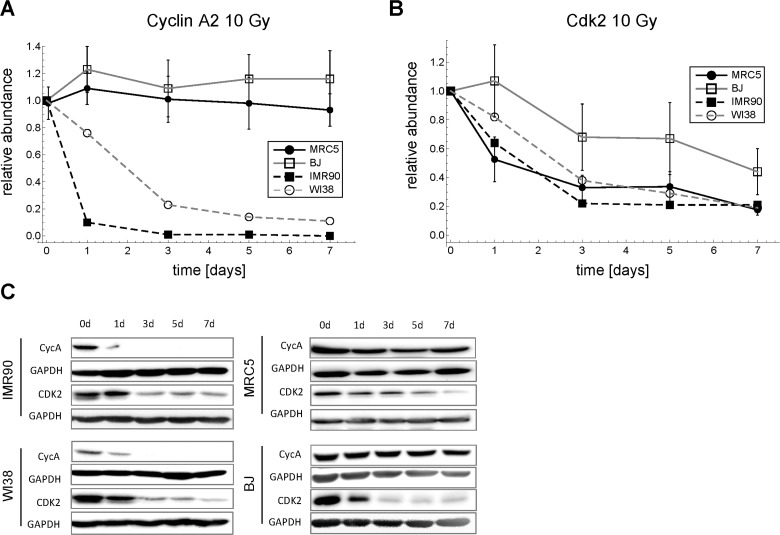
Figure 9.
Time series of Cdk2 and Cyclin A2 expression in four different primary human fibroblasts after 10 Gy IR. (
A
) Cyclin A2 time series (mean ± SEM (n≥3)). (
B
) Cdk2 time series (mean ± SEM (n≥3)). (
C
) Representative Western blots for A and B.