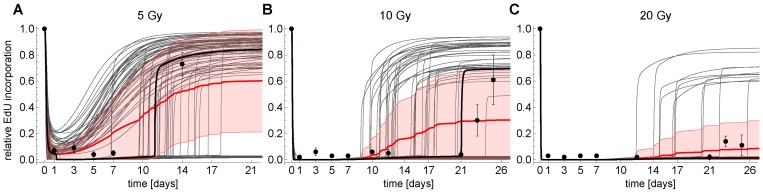
Figure 6.Simulated (CycE/Cdk2-a) and measured (EdU) time series of cells at G1-S transition for (A) 5 Gy IR, (B) 10 Gy IR and (C) 20 Gy IR, respectively. Thick black line: simulated CycE/Cdk2-a using the parameterized model (Figures 3, S4). Thin gray lines: Monte-Carlo simulation (MCS) of CycE/Cdk2-a using the parameterized model. Thick red line: Average MCS. Red shaded region: Standard deviation of MCS. Dots: Measured mean relative EdU incorporation ± SEM (n≥3).